A technical drawing contains much more than a picture of a part. It describes dimensions, tolerances, holes, threads, surface finish and manufacturing instructions. Turning that information into usable data means finding small marks, reading them correctly and preserving their position on the page.
That last requirement matters. A system might read 50 ±0.2 correctly but place it beside the wrong feature. For software that supports engineering or quotation workflows, the number alone is not enough.
Drawing2Data-Bench is COGITA's toolkit for developing and evaluating AI for this problem. It connects three parts of the work: generating labelled drawings from CAD files, testing vision-language models, and training a dedicated detector.
The documented experiments show a useful pattern: general-purpose models can recover much of the text, but precise localization remains difficult. A dedicated RF-DETR detector achieves the highest box precision in the reported comparison, while Gemini 3.5 Flash achieves the highest box F1. Understanding that difference helps explain why the toolkit contains all three components.
What the repository contains
Component
What it does
Why it matters
generation/
Converts 3D CAD models into 2D drawing images and matching labels.
Creates training examples without manually marking every annotation.
benchmarks/
Runs models on drawings and evaluates their structured predictions.
Separates text extraction quality from the ability to locate annotations.
extraction/
Trains and runs an RF-DETR Large detector.
Provides a specialized model for finding annotation regions.
The workflow starts with a CAD model. The generator produces an image and its reference labels. Those pairs can then be used both to train a detector and to evaluate models against known answers. Each component is described in the repository overview.
1. Generate labelled 2D drawings from 3D CAD
Training an image model requires examples of what it should find. For a technical drawing, that might mean a rectangle around a dimension, a label saying what kind of annotation it is, and the text printed inside it.
Creating these labels by hand takes time. A single page can contain dozens of small annotations, and the person labelling it needs to understand engineering notation.
The repository's generator, AutoDraft, creates the drawing and its labels together. It accepts STEP, IGES and BREP files, which store 3D CAD geometry. It uses that geometry to select views, draw the part, add dimensions and callouts, and arrange them on a sheet. The output is a PNG image and COCO annotations. COCO is a common dataset format that records objects, their categories and their positions in an image.
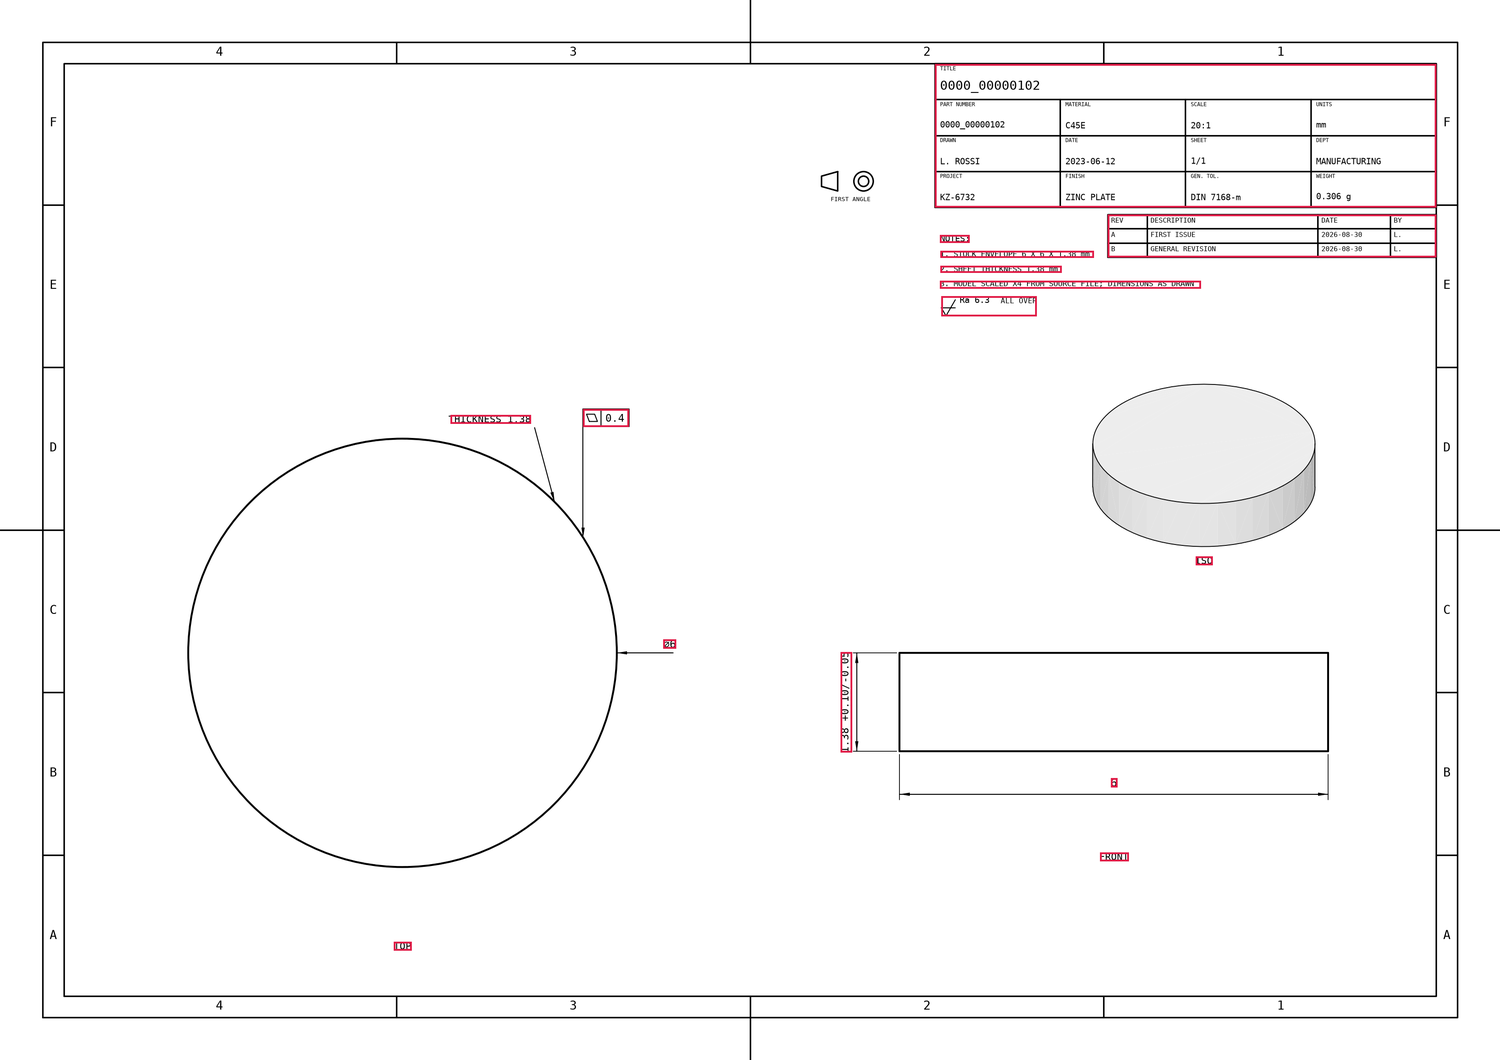
A generated drawing with its reference labels. The red boxes come from the generator's annotation records; they are the answers a detector is expected to learn.
AutoDraft supports 12 annotation categories, including dimensions, radii, chamfers, bores, threads, surface-finish symbols, notes, tables and view captions. It also covers GD&T, or geometric dimensioning and tolerancing, and datums, the reference features used to define measurements and tolerances.
An annotation includes its category, text and bounding box. Additional fields preserve information such as the measured value, view and whether a specification was generated artificially. Most boxes focus on the annotation itself rather than the long dimension or leader line around it. A table is represented by one box around the complete block.
Variety helps a model learn more than one layout
AutoDraft provides ten drawing styles, with different sheet layouts, arrowheads, text placement, tolerances and title blocks. It can create section views that reveal internal features, enlarged detail views, and separate views of bodies in an assembly. Presentation details also vary within a style.
This matters because a model trained on one fixed layout may learn where labels usually appear instead of learning to recognize them. A broader range of layouts gives developers a better starting point for training models that process 2D drawings.
The labels include text, so the generated data could also support future OCR or vision-language fine-tuning. The training code currently supplied in this repository focuses on object detection.
There is one distinction to preserve: some specifications are synthetic. Surface-finish values are generated, and certain other annotations can be generated when the CAD file lacks embedded manufacturing information. These items are flagged. They can teach a model what a symbol or label looks like, but their invented values should not be treated as real requirements for the original part. See the generation documentation for the supported conventions and limitations.
2. Measure what Gemini and GPT actually extract
A vision-language model, or VLM, accepts images as well as text. Drawing2Data-Bench includes adapters for Gemini and GPT models through OpenRouter, alongside the local detector.
The benchmark asks each VLM to return structured features: the annotation's text, category, bounding box and confidence. Predictions are saved as JSON, then compared with the reference labels. A YAML configuration selects the dataset, models, metrics and sample count.
This makes it possible to ask three separate questions:
Did the model find the annotation? Its predicted box must overlap the reference box sufficiently.
Did it read and classify the annotation correctly? The text and category must match.
Did it do both at the same location? The text, category and position must all be correct.
For box matching, the benchmark uses intersection over union, or IoU: the area shared by two boxes divided by the total area covered by them. A match requires IoU above 0.5. This makes the evaluation stricter than simply checking whether a box is somewhere near the right number.
The reported comparison
The benchmark documentation reports a run named benchmark_15, using 15 generated drawings. The following table reproduces its localization results. All three scores are better when higher.
Model
Box precision
Box recall
Box F1
Local RF-DETR detector (custom)
0.9777
0.6050
0.7474
Gemini 3.1 Flash Lite
0.6525
0.6381
0.6453
Gemini 3.5 Flash
0.7762
0.7569
0.7664
GPT-5.6 Luna*
0.2066
0.2029
0.2047
GPT-5.6 Terra
0.5363
0.3674
0.4361
GPT-5.6 Sol
0.5430
0.5580
0.5504
Source: documented benchmark results. Luna's scores cover 14 outputs because one response exceeded an output-length limit. Model names follow the repository.
Precision tells us what proportion of the predicted boxes match reference annotations. Recall tells us how much of the reference annotation inventory was found. F1 combines the two, so a model cannot achieve a strong F1 simply by returning a few very accurate boxes.
The local detector's precision of 97.77% is higher than every VLM in this run. Its recall of 60.50%, however, shows that it still misses many annotations. Gemini 3.5 Flash finds more of them and achieves the best balance of precision and recall.
These box scores ignore text and category. A correctly located rectangle can count as a match even if its text is empty or its class is wrong.
Reading the text is only part of the problem
The feature metrics add text and category to the evaluation. The first column below ignores position; the second also requires the annotation to be in the right place.
VLM
Exact text + category F1
Exact text + category + location F1
Gemini 3.1 Flash Lite
0.8352
0.5922
Gemini 3.5 Flash
0.8615
0.6797
GPT-5.6 Luna*
0.8279
0.1869
GPT-5.6 Terra
0.7246
0.4033
GPT-5.6 Sol
0.8529
0.5041
Source: the same benchmark results, with the same 14-output exception for Luna. Exact matching compares the stored text and category. Table features use labels such as TITLE BLOCK; this run does not evaluate the transcription of every table cell.
Every model loses ground when location becomes part of the requirement. For Gemini 3.5 Flash, the score falls from 0.8615 to 0.6797. For GPT-5.6 Sol, it falls from 0.8529 to 0.5041.
That gap is the most useful finding for developers. A model can return many correct labels without reliably placing them on the drawing. A convincing text response therefore does not establish that the drawing has been extracted accurately. Even correct annotation localization is only one step toward linking each label to the physical feature it describes.
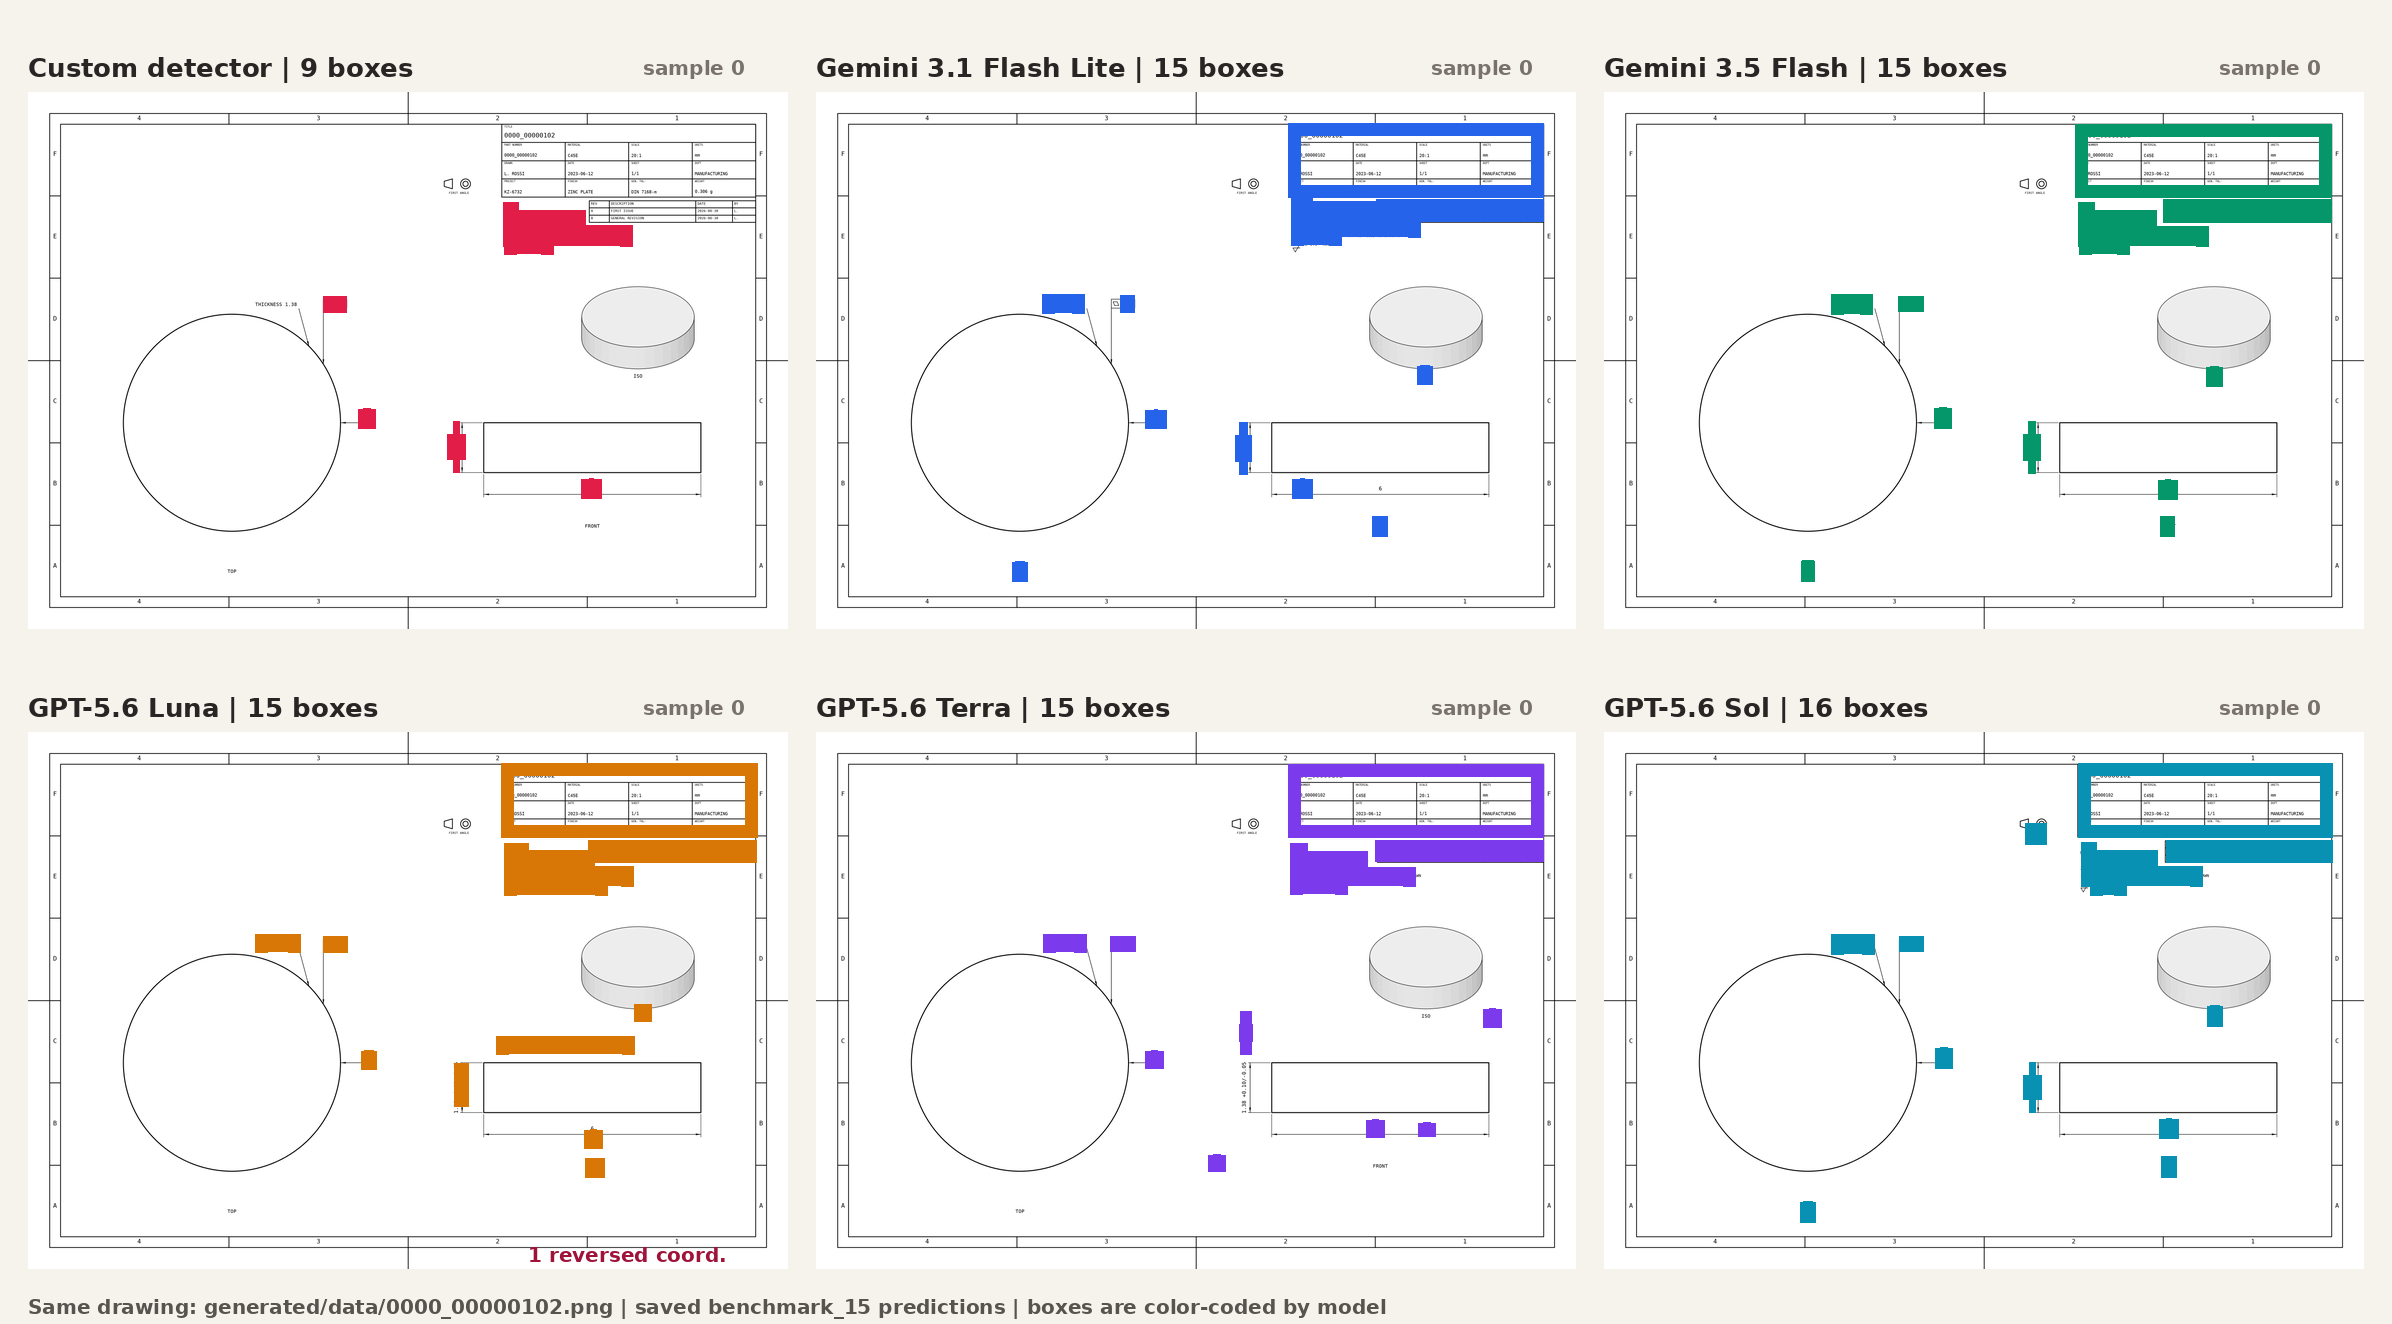
The repository's comparison of six models on one drawing. These are model predictions, not reference boxes. The panels illustrate differences in coverage and placement; the tables above summarize the reported run.
3. Train a dedicated RF-DETR detector
The extraction component uses RF-DETR Large, an object detector trained to find and classify annotation regions.
Its job is to return boxes around objects such as dimensions, notes and tables. It does not transcribe their text. The benchmark adapter returns an empty text field for each detection, which explains the detector's zero scores on the reported text metrics.
The extraction documentation describes a generated dataset of 9,378 images and 228,327 annotations, divided as follows:
Split
Images
Annotations
Training
6,513
158,727
Validation
1,886
45,942
Test
979
23,658
Training examples teach the model; validation examples track its progress; test examples are held aside for evaluation. These dataset counts describe the documented training work, while the VLM comparison above uses the separate 15-sample benchmark configuration.
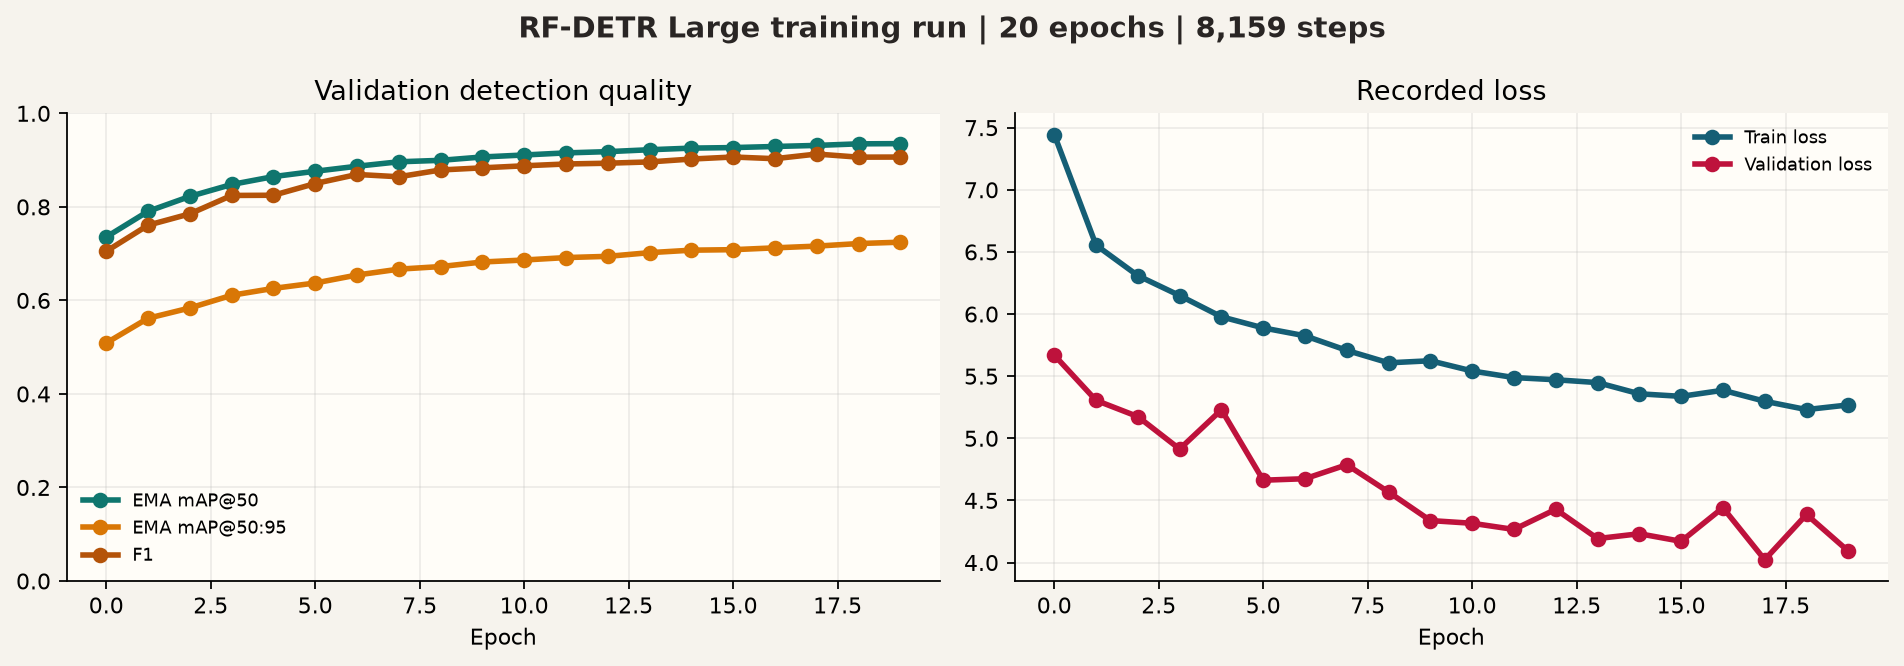
The reported training run used 20 epochs, meaning 20 passes through the training data. The training script also applies transformations such as rotation, perspective distortion, blur, noise and compression to expose the detector to less pristine images.
Recorded training curves supplied with the repository. Detection scores improve across the run, while the training and validation error measures generally decrease.
The documentation reports a final validation mAP@50 of 0.9352 and mAP@50:95 of 0.7245 for the averaged model weights. These are object-detection scores: the second evaluates box matching across a range of increasingly strict overlap requirements. They come from a different evaluation setup and should be kept separate from the small benchmark's F1 scores. The extraction documentation provides the full training settings and per-class results.
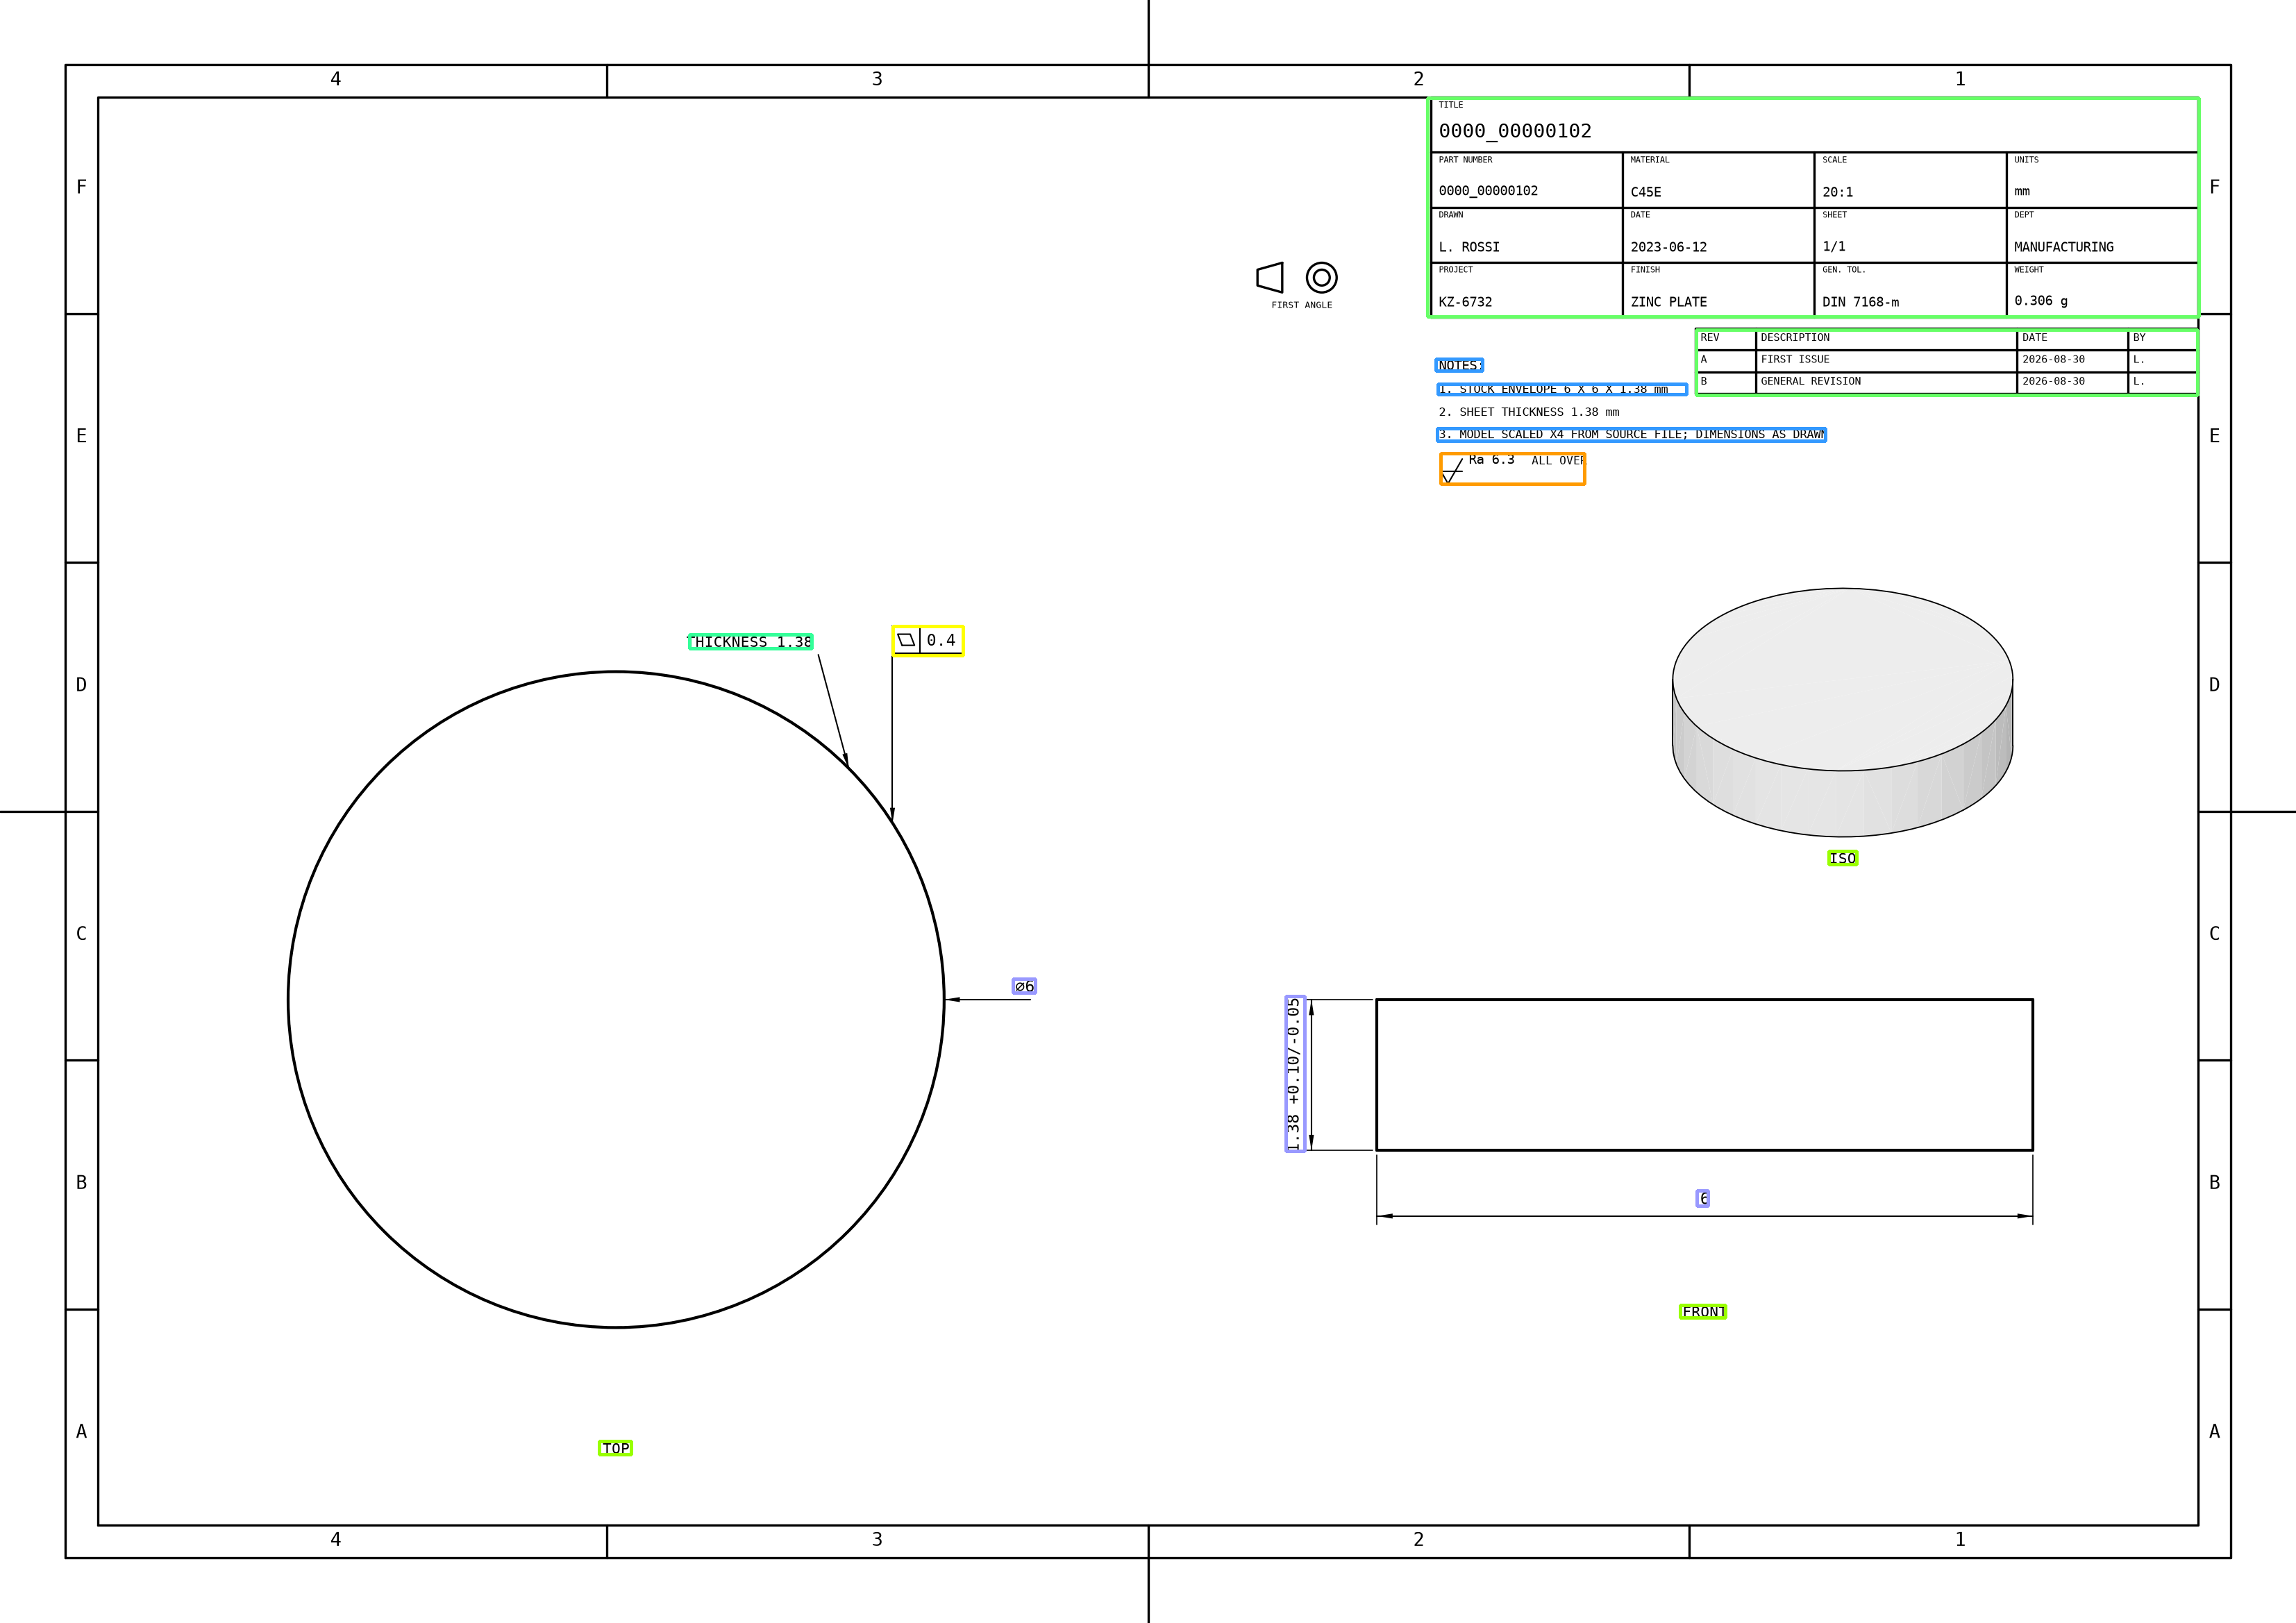
The standalone inference example contains 14 detections at a confidence threshold of 0.5. It shows detected regions, without an OCR transcription. It is a separate example from the six-model comparison above.
In the reported benchmark, the detector exceeds four of the five VLMs on box F1 and all five on box precision. That supports a practical direction for further work: use a specialized model to find promising regions, then pass those crops to OCR or a VLM for reading. The repository provides the detector and evaluation tools; this combined reading pipeline remains a next step.
How to try the toolkit
Start by cloning the repository and installing its dependencies:
The supplied training script selects CUDA directly. The few included CAD examples are useful for exploring the generator; reproducing the documented training results requires the larger dataset and corresponding setup.
For VLM evaluation, the benchmark guide explains the configuration and the OPENROUTER_API_KEY setting. Benchmark commands run from benchmarks/. The generated benchmark dataset has its own expected location, benchmarks/datasets/generated/data/; creating the training dataset alone does not populate it.
The repository links to a shared artifact folder for larger files. The reviewed Git checkout contains the source code, example CAD files, documentation and figures, but does not include the full training dataset, checkpoints or raw benchmark_15 outputs.
What these results establish
Drawing2Data-Bench provides a concrete starting point for generating training data and measuring specific drawing-understanding tasks. Its reported results show why text quality, localization precision and annotation coverage need separate evaluation.
The current evidence also has clear limits. The comparison uses a small synthetic sample, and the documentation reports weak transfer of the detector to real printed drawings. All VLMs use a shared prompt and coordinate convention, so this is a comparison under that setup. Different prompts or preprocessing could change the ranking. The numbers in this article reproduce the repository's documented experiments; they were not independently rerun for this article. A fresh reproduction should also verify coordinate scaling and category mappings in the current adapters.
For teams building engineering software, the toolkit makes the next experiments tangible: generate examples, inspect the labels, compare models on representative drawings, and measure what improves when detection and text reading are combined.
AI vs. automation is becoming an increasingly important question for manufacturing companies. As factories collect more data, connect more machines and digitalize more workflows, managers often face the same dilemma: should we automate the process with traditional rules, or do we need artificial intelligence?
The answer is usually simpler than the technology itself.
Traditional automation says: “If X happens, do Y.” AI says: “Based on the available data, estimate, predict or interpret what is likely to happen next.”
Both approaches are valuable. They simply solve different classes of problems.
That distinction matters because the most expensive mistake is often not failing to implement AI. It is using AI where a simple rule-based system would be cheaper, safer and easier to maintain — or relying on rigid automation where the real problem requires prediction, interpretation or pattern recognition.
What Is Traditional Automation?
Traditional automation is designed for processes that are predictable and can be described using explicit rules. The system does not need to “understand” the situation. It only needs to follow logic defined in advance.
The basic model is:
IF X → THEN Y
This principle can be implemented in many different technologies: industrial control systems, PLC logic, workflow engines, scripts, ERP integrations, robotic process automation or standard business software.
For example:
A form is submitted → the data is saved in the ERP system.
A machine reaches a defined temperature → an alarm is triggered.
An invoice arrives → it is forwarded to the appropriate person for approval.
A production cycle is completed → the result is saved and the next stage begins.
None of these situations necessarily requires AI.
If the condition can be clearly defined and the correct reaction is known in advance, classical automation is usually the better option. It is often cheaper to implement, easier to test and more predictable in production environments.
How Is AI Different from Automation?
Artificial intelligence becomes useful when the answer cannot be easily expressed as a fixed set of rules.
Instead of programming every possible condition manually, we build a model that learns patterns from data and uses those patterns to generate an output.
A simplified AI workflow looks like this:
DATA → MODEL → PREDICTION / CLASSIFICATION / RECOMMENDATION
Examples include:
forecasting future demand,
predicting equipment failures,
detecting product defects in images,
recommending products or actions,
classifying and extracting information from documents,
recognizing natural language,
estimating future raw-material requirements.
One distinction is important: an AI model does not “know” what should happen in the human sense. It generates an output based on statistical patterns learned from data.
This means AI systems are usually probabilistic rather than perfectly deterministic. A model may estimate that a machine has an 82% probability of failure, classify an image as defective with a certain confidence score, or predict demand within an expected error range.
That uncertainty is not necessarily a weakness. In many business problems, uncertainty already exists. AI simply helps quantify it.
AI vs. Automation: The Key Differences
Criterion
Traditional Automation
AI
Logic
Explicit rules
Model learned from data
Typical structure
If X, then Y
Based on data, predict X
Data requirements
Can be relatively simple
Usually critical to performance
Process predictability
Best for highly predictable processes
Useful when outcomes depend on complex patterns
Handling exceptions
Requires additional rules
Can recognize patterns across many variables
Learning
No model training
Model is trained and can later be updated or retrained
Typical implementation cost
Usually lower
Often higher
Maintenance
Rules, integrations and process logic
Data, model performance, infrastructure and integrations
Best use cases
Repeatable, rule-based processes
Prediction, classification and ambiguous problems
This comparison shows why discussing AI vs. automation as if one technology will replace the other is misleading.
Automation is not an outdated version of AI. It is a different tool.
When Should You Choose Traditional Automation?
Automation is usually the right choice when the process is stable, repeatable and easy to describe.
Choose traditional automation when:
the process repeats in a similar way,
the decision rules are known,
the expected result is predictable,
there are relatively few exceptions,
you do not need forecasting or pattern recognition.
A simple manufacturing example
Imagine that a machine completes a production cycle.
The system needs to perform four actions:
If cycle = completed → save result → send notification → start the next stage.
This is a perfect automation problem.
Adding machine learning would create unnecessary complexity. You would need data pipelines, model validation, monitoring and possibly retraining — without solving a problem that was difficult in the first place.
In this case, AI would not make the system smarter. It would simply make it more expensive.
When Does AI Make More Sense?
A useful question is:
Does the correct output depend on patterns that we cannot describe reliably with a small set of rules?
If the answer is yes, AI may be the appropriate solution.
Example: predictive maintenance
Consider equipment monitoring in a production plant.
A traditional automation rule might look like this:
If temperature > 90°C → trigger an alarm.
This is useful. However, it only reacts after a predefined threshold has been crossed.
An AI-based predictive maintenance system can analyze temperature together with vibration, load, operating time, historical failures, pressure and other variables. The model can then estimate the probability of failure during the next several hours or days.
The difference is fundamental.
Automation reacts to a condition we already understand. AI can detect combinations of signals that may be difficult for a human engineer to express as a simple rule.
Example: quality control
Traditional automation works well when product quality can be checked against a measurable threshold.
If dimension > allowed tolerance → reject the product.
But imagine a surface defect that appears in many shapes, sizes and orientations. Writing thousands of rules for every possible visual variation may be impractical.
A computer vision model can instead learn patterns from images of correct and defective products and classify new cases automatically.
Example: demand forecasting
A rule-based inventory system can say:
If stock < minimum level → order 500 units.
An AI forecasting system can go further. It can analyze historical sales, seasonality, promotions, customer behavior and other variables to estimate future demand.
The first system executes a policy. The second helps determine what the policy should respond to.
The Better Question Is Often AI + Automation
The most useful industrial systems frequently combine both approaches.
Instead of asking only AI vs. automation, companies should also ask how AI and automation can work together.
Consider predictive maintenance again.
The AI model produces the following output:
Probability of failure within the next three days: 82%.
Then traditional automation takes over:
If failure probability > 80% → create a maintenance ticket in the CMMS → assign the appropriate priority → notify the technician.
This architecture separates two responsibilities.
AI interprets the data. Automation executes the action.
That pattern can be applied across many industrial use cases:
AI detects a visual defect → automation removes the product from the line.
AI forecasts unusually high demand → automation creates a procurement task.
AI classifies an incoming document → automation routes it to the correct workflow.
AI estimates abnormal machine behavior → automation sends the alert to the correct maintenance team.
This is often where the largest business value appears. AI provides a better signal, while automation turns that signal into a repeatable operational process.
Five Questions to Ask Before Implementing AI
Before starting an AI project, companies should evaluate the problem rather than the popularity of the technology.
1. Can the problem be solved with a simple rule?
If a small number of deterministic rules can solve the problem reliably, traditional automation will usually be faster and cheaper.
2. Do we have enough relevant data?
AI performance depends heavily on data quality and relevance. A company may collect large amounts of information and still lack the specific data needed to train a useful model.
3. Is the process already predictable?
If the correct outcome is known in advance, machine learning may add little value. AI is most useful where prediction, classification or interpretation is genuinely required.
4. What is the cost of an error?
AI models are not perfectly accurate. Therefore, companies must define acceptable error rates and determine what happens when the model is uncertain or wrong.
For high-risk processes, the right architecture may include confidence thresholds, additional business rules or human approval.
5. Will AI generate measurable ROI?
“We want to use AI” is not a business case.
A better question is: what measurable problem will the system solve?
Will it reduce downtime? Improve yield? Lower scrap? Save engineering hours? Increase forecast accuracy? Reduce manual document processing?
The value of an AI project should be connected to an operational KPI from the beginning.
A Simple Decision Framework for AI vs. Automation
You can reduce the entire decision to three questions.
1. Is the process repeatable and can it be described with clear rules?
Yes → start with traditional automation.
2. Does the correct outcome depend on complex patterns in data?
Yes → consider AI.
3. Does the AI output need to trigger a predictable operational action?
Yes → combine AI with automation.
This framework is deliberately simple. Real industrial systems can be more complex, but the logic remains useful because it forces the project team to define the problem before selecting the technology.
AI Does Not Replace Good Process Design
The current excitement around artificial intelligence can create the impression that every digital transformation project should contain an AI component.
That is rarely true.
A poorly designed process does not automatically become better because a model has been added to it. In many cases, the right first step is process standardization, data integration or basic automation.
Once the process is stable and the relevant data is available, AI can be introduced where it creates a measurable advantage.
This approach is especially important in manufacturing. Production environments require reliability, integration with existing systems and clear responsibility for operational decisions. Technology should reduce uncertainty and complexity, not introduce them without a business reason.
Conclusion: Choose the Tool That Matches the Problem
The debate around AI vs. automation should not be framed as a competition between a modern technology and an older one.
Traditional automation is the right tool when the process is predictable and the rules are known. AI becomes valuable when the problem requires interpreting data, recognizing complex patterns or predicting future outcomes.
And in many of the strongest real-world solutions, the two technologies work together.
AI estimates what is likely to happen. Automation makes sure the appropriate action actually happens.
For manufacturing companies, this distinction can prevent unnecessary investment and help focus AI projects on areas where advanced models can produce real operational value.
At COGITA, we believe that advanced AI should not be implemented for its own sake. It should solve concrete problems, integrate with real processes and create measurable value for organizations and the people who operate them.
AI vs. automation is becoming an increasingly important question for manufacturing companies. As artificial intelligence becomes more accessible, many organizations are asking whether their processes should be automated in the traditional way, enhanced with AI, or redesigned around machine learning models.
The distinction is simpler than it may seem:
Automation says: “If X happens, do Y.” AI says: “Based on the available data, predict, classify, or interpret what should happen next.”
This difference matters because not every digitalization project requires artificial intelligence. In many cases, traditional automation is still the most effective, reliable, and cost-efficient solution.
The most expensive mistake is often not failing to implement AI. It is using the wrong technology for the problem.
What Is Traditional Automation?
Traditional automation works best when a process is predictable and can be described with clear rules. The system does not need to interpret the situation. It simply executes predefined instructions.
The logic can usually be reduced to:
IF X → THEN Y
Typical examples include:
A form is submitted → the data is saved in the ERP system.
A predefined condition is met → a notification is sent.
A machine reaches a specified value → a procedure starts.
An invoice arrives → it is forwarded for approval.
Inventory drops below a threshold → a replenishment process begins.
The key characteristic is predictability. We already know what should happen in a specific situation.
There is nothing outdated about this approach. In manufacturing, a huge number of processes depend on deterministic logic. PLC systems, alarms, workflows, ERP integrations, robotic processes, and production control systems often operate successfully because the rules are known in advance.
If those rules can be described clearly, introducing AI may only make the process more expensive and difficult to maintain.
How Is AI Different from Automation?
AI becomes useful when the problem cannot easily be expressed as a complete set of rules.
Instead of telling the system exactly what to do in every possible situation, we provide data and use a model to identify patterns. The model can then generate a prediction, classification, recommendation, or probability.
A simplified AI workflow looks like this:
DATA → MODEL → PREDICTION / CLASSIFICATION / RECOMMENDATION
Typical AI applications include:
demand forecasting,
predictive maintenance,
computer vision quality control,
recommendation systems,
document analysis and classification,
language understanding,
raw material demand forecasting,
production process optimization.
However, one important point is often misunderstood: AI does not “know” what to do.
An AI model generates an output based on patterns found in data and on the way the system was trained or configured. Its output is often probabilistic rather than fully deterministic.
That is why AI systems require data quality control, testing, monitoring, performance metrics, and a strategy for handling errors.
AI vs. Automation: Key Differences
Criterion
Traditional Automation
AI
Logic
Predefined rules
Model learned from data
Typical decision
If X, do Y
Based on data, predict or classify X
Data
Can be simple
Usually critical
Process predictability
High
Can handle uncertainty
Handling exceptions
Requires additional rules
Can recognize complex patterns
Learning
No
Possible through training or retraining
Implementation cost
Usually lower
Often higher
Maintenance
Rules and workflows
Data, model, infrastructure, monitoring
Best use case
Repeatable processes
Predictive or ambiguous problems
The central question in the AI vs. automation discussion is therefore not which technology is more advanced.
The right question is:
Which technology matches the structure of the problem?
When Should You Choose Automation?
Traditional automation is usually the better option when:
The process is repetitive.
The rules can be defined clearly.
The expected outcome is predictable.
There are relatively few exceptions.
No forecasting or complex interpretation is required.
Example: A Production Cycle
Imagine that a machine completes a production cycle.
The required logic is:
If cycle = completed → save the result → send information → start the next stage.
This is a classic automation problem.
There is no hidden pattern to discover. No prediction is required. The system already knows exactly what should happen.
Using AI in this case would be unnecessary complexity. It would introduce additional development, testing, monitoring, and maintenance without creating meaningful business value.
Automation is not the simpler substitute here. It is the correct engineering solution.
When Does AI Make More Sense?
A useful question to ask is:
Does the result depend on patterns that we cannot easily describe using explicit rules?
If the answer is yes, AI may be appropriate.
Predictive Maintenance: Automation vs. AI
Predictive maintenance is one of the clearest examples.
A traditional automated system might use a threshold:
If temperature > 90°C → trigger an alarm.
This is effective if temperature above 90°C is already known to be a dangerous condition.
But AI can address a different problem:
Based on temperature, vibration, machine load, operating history, previous failures, and other parameters, predict the probability of failure within the next few days.
The difference is significant.
Automation reacts to a known condition.
AI tries to identify a complex pattern that may indicate future failure before a simple threshold is reached.
This does not make the automation obsolete. In fact, the two technologies often work best together.
Quality Control: Rules or Computer Vision?
The same distinction applies to quality control.
If a product should be rejected whenever a measurable dimension exceeds a fixed tolerance, traditional automation is sufficient:
If dimension > X → reject product.
However, some defects cannot easily be described with numerical rules.
A scratch, deformation, incorrect assembly, discoloration, unusual texture, or visual anomaly may be obvious to an experienced quality inspector but difficult to represent as a fixed rule.
In this case, computer vision can analyze images and classify products based on patterns learned from data.
The AI system can identify the defect, while the automation layer decides what to do next.
For example:
AI detects a likely defect → automation removes the product from the line → the quality system records the event.
Demand Forecasting: When Rules Are Not Enough
Inventory management provides another practical example of AI vs. automation.
A traditional approach might use a rule such as:
If inventory < X → order Y units.
This can work very well when demand is stable.
But demand may depend on many factors:
seasonality,
promotions,
customer behavior,
market conditions,
holidays,
product lifecycle,
historical sales,
external variables.
A fixed threshold may not capture those relationships.
An AI model can use historical data to forecast future demand and estimate how much stock may be needed next week or next month.
Automation can then use the forecast to trigger replenishment workflows.
The Better Model Is Often AI + Automation
For many companies, the most useful answer is not AI vs. automation.
It is AI + automation.
AI can interpret or predict.
Automation can execute.
For example:
AI: The model estimates an 82% probability that a machine will fail within five days.
Automation: If failure probability > 80%, create a maintenance ticket in the CMMS system and notify the responsible technician.
This architecture uses each technology for what it does best.
AI handles uncertainty, prediction, and complex patterns.
Automation handles repeatable execution, integration, workflows, notifications, and business rules.
In practice, an AI model is rarely useful as a standalone component. Its prediction usually has to be connected to a real business process.
Data needs to be collected. The model needs to generate a result. The result must reach the right system. A threshold may have to be applied. Someone may need to approve the decision. The action must be executed and recorded.
This is why many successful industrial AI systems are hybrid systems.
AI vs. Automation in Document Processing
Document workflows illustrate the same principle.
Traditional automation can perform tasks such as:
If an email contains a PDF attachment → save it in a folder.
But what if the system needs to understand the document?
It may need to:
identify the document type,
extract information,
understand different layouts,
classify the content,
detect missing information,
route the document to the correct process.
This is where AI can become valuable.
A complete process might look like this:
Receive document → AI classifies it and extracts information → automation enters the data into ERP → uncertain cases go to human review.
Again, AI and automation complement each other.
5 Questions to Ask Before Implementing AI
1. Can the Problem Be Solved with a Simple Rule?
If yes, traditional automation is probably the better starting point.
A deterministic solution is usually easier to implement, test, explain, and maintain.
2. Do You Have Enough Relevant Data?
AI needs useful data.
Having large amounts of data does not automatically mean that an AI project will work. The data must contain information related to the outcome you want to predict.
Before building a model, check whether the necessary signals actually exist.
3. Is the Process Outcome Predictable?
If every valid input should always produce the same output, traditional software may be sufficient.
AI becomes more interesting when the answer depends on probability, interpretation, classification, or complex relationships between many variables.
4. Is the Cost of an Error Acceptable?
AI systems do not operate with perfect accuracy.
A model can generate false positives, false negatives, or uncertain results.
Therefore, the key question is not only:
How accurate is the model?
It is also:
What happens when the model is wrong?
For high-risk decisions, companies may need human approval, additional safeguards, or a hybrid system in which AI recommends an action but deterministic rules determine what is allowed.
5. Will AI Deliver Measurable ROI?
AI should not be implemented simply because an organization wants to “have AI.”
It should solve a concrete business problem.
The expected value may come from:
lower machine downtime,
fewer quality defects,
better demand forecasts,
lower material waste,
reduced energy consumption,
faster document processing,
better production planning,
higher employee productivity.
The business problem should always come before the model.
AI vs. Automation: A Simple Decision Framework
The decision can be reduced to three questions.
Can the process be described with stable and unambiguous rules?
Yes → choose automation.
Does the result depend on complex patterns in data, interpretation, or prediction?
Yes → consider AI.
Does AI generate a prediction or recommendation that should trigger a repeatable operational action?
Yes → combine AI with automation.
This framework helps avoid two common mistakes.
The first is using AI where a few simple rules would work better.
The second is creating increasingly complicated rule-based systems for problems that are fundamentally predictive.
Conclusion: Choose the Technology That Matches the Problem
The discussion around AI vs. automation should not be framed as a competition between a modern technology and an outdated one.
Both approaches remain valuable because they solve different types of problems.
Automation works best when we know the rules of the process.
AI becomes valuable when the problem requires interpreting data, recognizing patterns, or predicting future events.
And in many manufacturing environments, the strongest architecture combines both technologies.
AI estimates what is likely to happen.
Automation makes sure the appropriate operational action is executed consistently.
That is why the first question in an AI project should rarely be:
“Which model should we use?”
A much better question is:
“What kind of problem are we actually trying to solve?”
Once that is clear, choosing between automation, AI, or a combination of both becomes much easier — and much more likely to generate measurable business value.
Implementing AI in Business
Various reports and studies attempt to capture the degree of AI development and adoption within the business sector.
The most comprehensive reports released so far include State of Polish AI 2021 and Map of Polish AI 2019. These reports offer an extensive list of Polish companies, even those with small AI teams. Unfortunately, much has changed over the past few years, and it’s a pity that these reports have not been updated.
Noteworthy is the list of Polish AI startups compiled by Dr. Przemysław Chojecki in mid-2023, which includes over 100 startups, as well as service companies—software houses—specializing in AI. A similar list of Polish startupswas created by Jan Szumada.
A much newer report is the EY Report: How Polish Companies are Implementing AI?. EY surveyed a large cross-section of companies (over 500) of varying sizes and from different sectors. The main conclusion: 20% of large and medium-sized enterprises in Poland have implemented AI-based systems, and 80% of companies that have completed AI implementation claim to have achieved benefits. Unfortunately, these results raise considerable doubts due to the lack of depth in the topic—what exactly do we mean by “AI implementation”?
Medical startups (170 from Poland) are thoroughly analyzed in the report Top Disruptors in Healthcare. This report is prepared by the AI in Health Coalition, which includes companies (such as COGITA) and other entities whose goal is to shape the application of artificial intelligence in the healthcare industry in Poland, benefiting patients and doctors alike.
A platform initiated by the ministry, ai4msp.pl, showcases many AI project implementations by Polish companies. It is intended to serve as a marketplace, although it is difficult to assess its current market significance.
Podcasts and interviews, such as Nieliniowy or 99twarzyAI, provide a fairly good overview of what is actually happening with artificial intelligence in Polish companies.
It’s worth noting that in the era of generative AI, companies are increasingly focusing on training their own staff (IT departments or others) and testing AI solutions internally rather than outsourcing work to qualified Data Scientists, who until recently had a monopoly on creating machine learning and artificial intelligence systems.
AI Companies Associations
Within the Polish software companies’ association SoDA, a working group on artificial intelligence—SoDA AI Research Group—was established last year, consisting of about 100 members from 30 Polish AI companies.
Two reports presented by this group are noteworthy.Human-AI Collaboration: Perspectives for the Polish Public Sector provides examples of AI projects completed in various areas of the public sector and the challenges associated with them. Meanwhile, the report Generative AI in Business(co-created by more entities than just SoDA) focuses strictly on generative artificial intelligence and presents its potential in various industries. This report is more focused on showcasing possibilities and tools rather than presenting actual AI projects implemented.
In recent months, the Chamber AI trade chamber was also established, which currently lists 44 companies dealing with AI solutions.
Courses and Communities
The last year and a half has also seen a huge increase in interest in artificial intelligence from non-technical people, programmers who have so far been dealing with other technologies, and individuals developing their own businesses.
Various groups have created noteworthy training, communities, and platforms, such as Elephant AI, AI_Devs, Campus AI, or Building AI Products. These courses vary greatly in level and outcomes, often leading individuals to join several different trainings. Some courses have thousands of participants.
In terms of industry events, long-standing cyclical, more technical initiatives continue to grow, such as Data Science Summit, ML in PL, PyData, or warsaw.ai. However, more local initiatives for AI enthusiasts are also emerging, such as AI Breakfasts, Masovian AI Fest, or GenAI Cracow.
In this category, the SpeakLeash community, which includes over 1,000 enthusiasts united around the idea of creating a large corpus of Polish language data that is then used to train Polish LLMs, is also worth mentioning.
It’s worth noting that in an era of rapid change driven by AI, authorities in this field are often individuals educated in other areas (philosophy, management) or celebrities. Such individuals gain a large audience with their loud marketing messages, offering their appearances at conferences, consultations, or training.
In the field of AI, government and international initiatives should also be mentioned. Since 2016, the development of the AI Strategy has been ongoing, with the milestone being the adoption of the “Policy for the Development of Artificial Intelligence in Poland from 2020″. However, this document went largely unnoticed in Polish business, making it difficult to assess its role in shaping AI-related reality.
Since 2018, the Ministry of Digitization has operated a Working Group on Artificial Intelligence, but despite the broad cross-section of specialists and several reports, it is difficult to notice a broader impact of this group on AI-related reality in Poland.
Certainly, public funding programs such as Ścieżka Smart play a significant role in the development of companies, although they seem insufficient compared to the funds allocated for AI development in other countries.
Traditional quality control methods are often time-consuming and prone to human error, leading to inefficiencies and increased costs. In this article, we present a hypothetical case study illustrating how an advanced image detection system can revolutionize quality control in the food industry, using a large fruit and vegetable processing company as an example.
Problem Description and Project Objective
The company specializes in producing jams, juices, canned vegetables, and frozen foods. It processes thousands of tons of raw materials daily on its extensive production lines. The main challenge for the company is maintaining high product quality, minimizing waste, and quickly identifying production defects, such as contamination, mechanical damage to fruits and vegetables, and non-compliance with quality standards. Traditional quality control methods proved inadequate, prompting the company to implement an AI-based automated image detection system.
The project's goal was to develop and implement an advanced AI system that would automatically inspect food products on the production line, identifying defects and damage. The system aimed to increase quality control efficiency by automating the process, reduce production waste by quickly detecting defects, and improve the overall quality of products delivered to the market, leading to higher customer satisfaction.
Data Preparation
Three months prior to the project, the company installed cameras at key stages of the production line. Cameras were installed at the raw material intake, over sorting lines, and at packaging machines. These strategic locations allowed monitoring the quality of raw materials and products at various production stages. The cameras captured images of raw materials such as apples, tomatoes, peppers, carrots, and potatoes, which were then analyzed for defects and damage.
Over three months, the company collected about 500,000 image records, with a daily increase of about 5,000 new images. This data was stored on local servers and in the cloud, ensuring easy access to large datasets. Each record included a timestamp, location on the production line, product type, and a description of the defect if detected. During data collection, some camera methods and locations were modified to improve the quality of the collected data. Missing data was supplemented by additional photo sessions and camera configuration improvements.
Model Selection and Training
Advanced AI technologies and tools such as Pytorch and OpenCV were used for system implementation. Convolutional Neural Networks (CNNs) were chosen for their effectiveness in image analysis tasks, thanks to their ability to automatically detect features and patterns. Transfer learning was also utilized, using the pre-trained YOLO model, which was adapted to the specific data of the food industry.
The image data was preprocessed using OpenCV, including color correction, lighting normalization, and noise removal. Data augmentation, such as rotation, scaling, and changes in brightness and contrast, was applied to increase the training dataset and improve model generalization. CNN models were trained on large image datasets, covering different classes of raw materials and various types of defects. The training process was accelerated using GPUs with NVIDIA CUDA technology, allowing efficient processing of large datasets.
Implementation and Integration
The image detection model was deployed on AWS servers with GPU support to ensure fast image data processing. AWS EC2 servers with p3.2xlarge instances were used for scaling and system performance. A RESTful API was created using Flask, enabling communication between the image detection system and the production line. The API handled HTTP POST requests for sending images and receiving analysis results.
The API was integrated with the company's existing production system, enabling automatic image transfer from cameras to the image detection system. The production system sent images to the API in real-time, and analysis results were returned to the production system for appropriate actions, such as removing defective products from the line.
Monitoring and management tools, such as Amazon CloudWatch, were implemented to ensure continuous system availability and performance.
Results Achieved
The system achieved 80% accuracy in detecting raw material defects, resulting in significant business benefits for the producer. The implementation reduced production waste by 20%, equivalent to 10 tons less waste per month.
The efficiency of raw material quality control increased by 50%, leading to faster and more accurate inspections. Assuming the cost of labor associated with raw material quality control is 50,000 PLN per month, the savings from increased efficiency amounted to 25,000 PLN per month.
Costs and Resources
The project involved three Data Scientists and a part-time Project Manager, lasting 4 months, covering data preparation, model training, and system deployment.
AWS servers were used for model training and image detection system deployment. Model training on EC2 p3.2xlarge instances cost 10,600 PLN for 900 hours of work. Deployment and operations on EC2 t3.large instances cost 900 PLN for 4 months of work. Data storage on Amazon S3 cost 700 PLN for 2 TB of data over 4 months, and using Amazon RDS for database storage cost 1,100 PLN.
The total project cost amounted to 513,300 PLN.
Monitoring and Optimization
The system was monitored for availability and performance using Amazon CloudWatch, and the image detection models were regularly updated monthly to account for changes in raw materials and new defect types. An alert system informed the team of any irregularities, such as performance drops or data availability issues.
Interaction with the Technical Team
Collaboration between teams was crucial for the project's success. Regular meetings were held between the data science, IT, production, and quality management teams to discuss project progress, exchange ideas, and identify potential issues. All project stages were thoroughly documented, including technical specifications, data analysis reports, A/B test results, and recommendations for further actions. Training was conducted for the production team on using the image detection system and interpreting the results to maximize the tool's potential.
Challenges and Future Directions
The project faced several challenges, such as ensuring system scalability to handle increasing amounts of data and raw materials, and continuously improving detection model accuracy through regular updates and algorithm optimization. Integration with various production systems and ensuring compatibility also posed challenges.
In the future, the food producer plans to expand the detection scope, introducing the detection of other defect types, such as structural deformations or color changes. Increasing automation through more advanced decision-making mechanisms on the production line and utilizing advanced analytics for predicting quality issues and optimizing production processes are the next steps in system development.
Summary
The implementation of an advanced image detection system brought significant benefits, such as reducing production waste, increasing the efficiency of raw material quality control, and improving product quality. Although the project faced some challenges, the business benefits of implementing the system were substantial, and the company plans further development and optimization of the system in the future.
This hypothetical case study shows how artificial intelligence can revolutionize the food industry, bringing tangible benefits to both producers and consumers.
Online stores must continuously tailor their offerings to the needs and preferences of customers to increase conversion rates and cart value.
Below, we will discuss step by step a hypothetical project to implement an advanced recommendation system in an electronics store, which could significantly improve sales metrics and the customer shopping experience.
Problem Description and Project Objective
Business Context
An online store specializing in electronics (laptops, smartphones, TVs, and accessories) observed that many customers were leaving the site without making a purchase. Despite a wide range of products, users struggled to find items that suited their needs. As a result, the conversion rates and average cart value were lower than expected, negatively impacting the store's revenue and profitability.
Project Goals
The project aimed to develop and implement an advanced recommendation system to:
Personalize product listings on category pages to present products most aligned with users' preferences and browsing history.
Introduce product recommendations on main pages and product subpages, suggesting items based on previous purchases and site behavior.
Segment users according to their shopping behaviors and preferences, allowing for better-targeted offers and marketing campaigns.
Expected Outcomes:
Increase the conversion rate by 15% within the first 6 months.
Raise the average cart value by 10%.
Improve overall customer shopping experience, leading to greater loyalty and more frequent returns to the store.
Data Preparation
Data Sources
The project utilized various data sources crucial for the successful implementation of the recommendation system:
Purchase History A CSV file containing the purchase history of users over a two-year period. The data included product information, purchase dates, prices, and product categories.
Product Feed A regularly updated product feed from the store's API, containing detailed information on available products (names, descriptions, prices, availability, technical attributes, and categories).
Eventserver The Eventserver collected data from the online store and stored it in a dedicated database. The events collected included product views (about 100 million records), clicks (about 1 million records), cart additions, and purchases (about 100 thousand records).
Data Quality
To ensure data quality, actions were taken to:
Data Completeness: Integrating and normalizing data from various sources (CSV, API, eventserver).
Data Cleansing: Removing duplicates, filling in missing values, and correcting errors.
Data Preparation and Processing Before building the recommendation system, several actions were taken to gain valuable business insights:
Data Integration: Data from different sources were integrated into a unified processing system, allowing the combination of product information with purchase history and user behaviors.
User Segmentation: Users were assigned to segments based on their shopping behaviors and preferences (e.g., tech enthusiasts, deal seekers, premium customers).
Behavior Analysis: The collected data allowed for the analysis of user behavior on the site, identification of the most viewed and purchased products, and determination of shopping patterns.
Implementation and Integration
Technologies and Tools
The implementation of the recommendation system utilized various models and artificial intelligence technologies:
Embeddings with OpenAI: Transforming product descriptions and user reviews into numerical format.
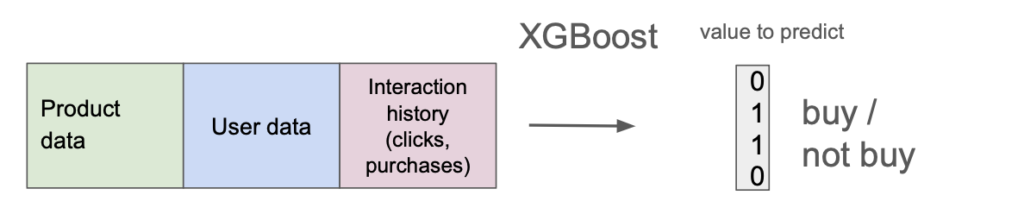
XGBoost: A predictive model for determining which products are most likely to be purchased.
SHAP: A tool for interpreting model results, helping to understand which user characteristics most influence the recommendation model's decisions.
Integration with Existing Systems:
E-commerce Platform Integration: The recommendation system was directly integrated with the store's e-commerce platform, AtomStore, allowing real-time recommendation display.
API: Enabled dynamic retrieval of product and user data and sending generated recommendations to the store's frontend.
Eventserver: Collected data on user activities, ensuring the continuous updating of recommendation models.
Results Achieved
After the system was implemented, A/B tests were conducted. The recommendation system returned its results for 50% of randomly selected users, while the rest received the usual product order (by popularity). This allowed for precise measurement of the model's quality.
Increase in Average Cart Value Thanks to recommended upsells, the average cart value increased by 4%. The comparison was made during two weeks of A/B testing. Assuming the average cart value before implementation was 500 PLN and there were 10,000 purchases per month, the monthly profit from this increase amounted to 200,000 PLN.
Increase in CR on the Website Users received more tailored product suggestions, leading to fewer site exits and more frequent purchases. The conversion rate (CR) increased by 4%, resulting in 800 additional monthly conversions and a profit of 416,000 PLN.
Costs and Resources
The main costs of the project were the wages of the development team.
Human Resources
Data Scientists: Three Data Scientists, with a total team cost of 300,000 PLN.
Project Manager: PM part-time, included in the overall team cost.
Project Duration: 2 months.
Infrastructure Costs
As the entire system was implemented in the cloud, additional costs included:
AWS EC2 Instances: Training model costs (2500 PLN) and deployment (450 PLN).
S3 Storage: Data storage costs (360 PLN).
Amazon RDS: Database storage costs (560 PLN).
Total Project Cost: 303,870 PLN.
Thus, the investment paid off two weeks after the solution was implemented.
Monitoring and Optimization
After implementing the machine learning model, it was crucial to monitor its performance and make necessary adjustments.
Monitoring was implemented using Amazon CloudWatch. Due to the introduction of new products and changing user preferences, automatic weekly model retraining was implemented. Additionally, an alert system was introduced to report anomalies.
Feedback Loop
For each recommended product, users could click a thumbs up or down to rate the recommendation's quality. This provided an additional source of information useful for retraining the AI model.
Conclusion
The hypothetical implementation of an advanced recommendation system in an electronics store was a key step in improving customer shopping experiences and increasing sales efficiency.
By personalizing the product offering based on user preferences, noticeable improvements were achieved in conversion rates and average cart value.
The project required integrating data from various sources and applying advanced machine learning technologies, such as XGBoost, which enabled effective processing and analysis of large volumes of data and generating accurate product recommendations in real-time.
In recent years, we have witnessed several breakthrough moments, such as the creation of the AlphaZero model in 2017, which achieved grandmaster level in chess and Go, and the development of the Transformer architecture in the same year, which underpins numerous language processing models. However, the release of the GPT-3.5 model as a chatbot, ChatGPT, on November 30, 2022, brought AI into the public eye. The use of AI has become widespread in private life and the search for business applications to save time, streamline processes, and increase profits.
It is important to note that the use of AI-based algorithms (or more precisely, machine learning) for business applications has been ongoing for at least several years. Common examples include systems recommending ads or other content to internet users, predictive systems in financial institutions, and image detection algorithms in industry. Although these algorithms continue to evolve, companies are far from fully utilizing AI's potential.
Therefore, in this article, I will not only present how to use generative artificial intelligence (such as ChatGPT or Midjourney) in your company but also describe more broadly how to approach identifying areas that can be improved by various types of AI algorithms.
Familiarize Yourself with Basic AI Tools
It is worth starting your AI journey by reviewing the available tools. There are already quite a few, each serving very different applications. Here are some examples.
Adobe Firefly is an advanced tool for generating and editing graphics, ideal for marketing and design departments. Synthesia, on the other hand, allows you to create videos with generated voices and characters, which is a great solution for producing training materials and presentations.
ChatGPT and Gemini are versatile tools that can help you create marketing content, handle customer service, respond to emails, or generate ideas. Grammarly, in turn, helps improve grammar and writing style, which is invaluable when creating high-quality marketing content and reports.
Turbologo and Logopony are logo-generation tools that can speed up the process of creating your company's visual identity. Canva offers a wide range of design tools, including those using generative AI models. You can create high-quality graphics with Midjourney or Leonardo.ai. If you need background music, check out Suno.
Tools such as Slides AI, Presentations AI, Pitch, and Beautiful.AI enable the creation of attractive presentations with automatic formatting, which can significantly save time and improve the visual quality of presented materials.
Do not forget to use meeting transcription tools like OtterAI, and text summarization systems like SummarizeBot.
For research teams, Scite.AI offers advanced capabilities for searching scientific information and significantly speeds up the research process.
It is worth experimenting with various tools to find those that best meet the needs of your business. They will certainly increase the efficiency of your employees. However, using these tools is just the beginning of AI possibilities in your company!
Experiment with Generative Systems
You have probably heard that to obtain high-quality results from generative models, it is crucial to write appropriate prompts. Relying only on short and intuitive prompts, you will quickly find that the responses generated by the tools are quite standard and repetitive. They are likely not to meet your company's needs.
Therefore, the next step will be to try and experiment with different prompts. This will help you better understand the capabilities and limitations of AI systems. You will also quickly learn the basic characteristics of AI algorithms:
A well-applied AI algorithm can save significant working time for your employees and ensure that their work is done better and more accurately.
An AI algorithm must have a precisely defined task that it performs.
Generic, general AI systems usually need to be heavily tailored to your company's specific problem to provide significant benefits.
The use of an AI system must be integrated into your company's processes and IT systems (through proper data flow) to ensure its use is convenient and time-efficient, and most importantly, to keep your company's data secure.
The final AI solution is created through trial and error, through experiments.
An AI systemnever works with one hundred percent accuracy, so you must consider handling errors and hallucinations (or simply consciously ignore them).
Build Your Assistants
After initial trials, which are more for fun than serious applications, you can start creating more advanced (yet still quick to build) AI solutions for your business.
This could involve creating a good prompt (i.e., an instruction for the model) and saving it for repeated use. For example, this could be an instruction for social media posts, where you define your brand's style, requirements for post length, and possible use of emojis, or hashtags.
In many tools (e.g., in Chat GPT), you can also upload files in various formats—whether spreadsheets (XLSX), documents (PDF, DOCX), or images (JPG). In this way, you will build agents for managing knowledge in your company, for instance, regarding employee information or quickly searching for information to respond to a client.
Explore the Capabilities of Other AI Groups
Generative models represent just a small part of the wide array of AI algorithms available. Likely, they do not fully leverage the potential inherent in the data collected by your company. Therefore, it is worthwhile to explore other classes of models to consider their use in your business.
Remember, using these models typically requires building a custom AI system by a Data Science team. Alternatively, you can opt for low-code or no-code tools where individuals without advanced programming skills can also create customized AI systems.
The most important types of non-generative ("traditional") AI include:
Computer Vision
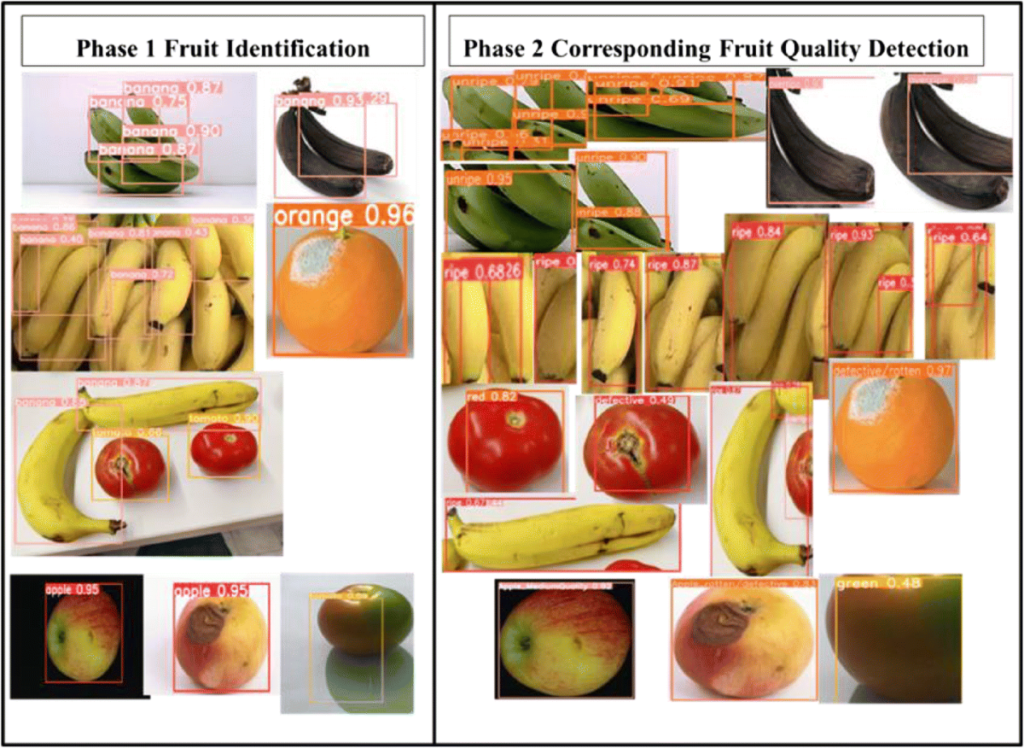
These algorithms typically take images or videos as input. Their outputs can range from classification and object detection (identifying objects using colored rectangles, for instance) to semantic segmentation—detecting entire areas of an image and labeling pixels representing specific objects.
Example of object detection and segmentation: (https://manipulation.csail.mit.edu/segmentation.html)
Image processing algorithms find wide applications across various industries. In manufacturing, they are used for quality control, monitoring production processes, and resource management. In medical diagnostics, they enable the analysis of X-ray images, MRIs, and other scans, aiding in the rapid detection of diseases and anomalies. Retail utilizes these technologies for customer behavior analysis, inventory management, and personalized offers.
Recommendation Systems
Crucial in e-commerce, streaming services, and digital marketing, recommendation systems analyze user preferences and behaviors to provide personalized recommendations for products, content, or services, thereby enhancing customer engagement and loyalty.
Predictive and Clustering Systems
Predictive algorithms analyze historical data to forecast future events, invaluable in sectors such as finance, logistics, and resource management. Clustering algorithms help identify patterns and segment data, beneficial in market analysis and customer management.
Optimization Systems
Optimization systems use AI algorithms to manage processes, resources, and logistics in the most efficient manner possible. They can significantly reduce operational costs and increase business efficiency. Examples include warehouse management, route planning for deliveries, production scheduling, machine and resource utilization optimization, and waste reduction.
Exploring these diverse AI capabilities can provide insights into how they can be effectively integrated into your business processes, enhancing productivity and decision-making across various domains.
Conduct Exploratory Workshops and Build an AI Culture
Harnessing the potential of AI in your company can greatly benefit from conducting exploratory workshops and cultivating an AI culture. These initiatives help teams better understand the capabilities offered by AI and how these technologies can be adapted to specific business needs.
Exploratory workshops are interactive sessions designed to identify areas within the company where artificial intelligence can bring the greatest benefits. During these workshops, employees from different departments collaborate to understand which problems can be solved using AI and what new opportunities AI can open up.
The introduction to workshops typically begins with a review of basic AI concepts, allowing participants to better grasp the concepts and terminology. Subsequently, specific use cases of AI in industries similar to your company's are analyzed. In the next stage, participants identify their own business challenges and needs that can be addressed using AI, and then collectively develop initial ideas for solutions.
Building an AI culture within the company also requires creating an environment that supports innovation and continuous learning. It is crucial to promote openness to new technologies and encourage employees to experiment with AI tools. Additionally, company leaders should actively support AI-related initiatives and lead by example through involvement in AI implementation projects.
Moving towards Larger Deployments
Customized AI solutions typically require much larger financial investments compared to simple AI tools, which are often free or cost a few hundred złotys per month. The cost of developing such solutions can range from tens to hundreds of thousands of złotys.
However, if you have a well-defined problem and a Proof-of-Concept that demonstrates the AI system meets your expectations, the benefits can appear quickly in the form of increased sales by several to several dozen percent, savings on losses, or savings of thousands of work hours for your employees.
Summary
Artificial intelligence in business encompasses a wide range of approaches. You can start with initial attempts on your own using ready-made tools that are free or very low cost. However, if you're looking for something more advanced and tailored to your company's specific needs, you should be prepared for higher costs and seek the assistance of technical experts. If you have any questions or would like to discuss your ideas further, feel free to reach out!
But as models have gotten more complex, it can be difficult to know what is causing them to make certain predictions. That is why we observe fast increase of interpretability tools such as SHAP or DALEX.
In this article, I will discuss some reasons why interpretability is so important. There are more reasons than you could expect and some of them are very not-obvious.
1. More confidence that model works well
One of the most important aspects of interpretability is that it allows you to gain confidence in your model and be sure that it does what it was supposed to do.
The first step of assessing model quality is properly-defined metric, depending on the application — it can be e.g. accuracy, f1 score or MAPE. However, even if you have chosen proper metrics, it can be computed in wrong way or can be non-informative. Hence, usually we can achive the highest confidence about the model quality only by understanding what it is doing and why give such predictions.
2. Building trust
In Machine Learning projects, trust is the foundation. Without trust, you cannot build relationships or collaborations. Trust allows you to work together and share data, knowledge, and expertise. It also allows you to continue working with each other in the future.
In order for your model to be interpretable and trustworthy, it needs to have clear explanations of what it does and why it does it. The more transparent you can make your model’s output, the more likely it will be that others will trust your results — and want to work with you again!
3. Debugging
Understanding the model and how it works is extremely important when the model’s output is below your expectations and you start to find out what is going on. If you do not understand the model, then it is very hard to debug if something goes wrong with your prediction results.
For example, if an algorithm does not give accurate predictions for some data points in a test set but does well on other data points, maybe good datapoints are from the same distribution that was in the training set. When you understand on which features your model looks at most, you can find that maybe wrong datapoints are outliers from the perspective of these features. Or maybe there are some missing features in these points.
4. Simpler alternative
Thanks to interpretability, you can know which features are important for your model, and propose simpler alternative models which have similar predictive power.
For example, suppose that you have a classification problem with thousands of features and you discover that only 10% of them are significant in predicting customer churn. Now you know which features matter and which do not, so it may be possible to remove unimportant features and train your model again. It will be faster, because it has less parameters. But also the process of data gathering and preprocessing will be simpler.
5. Extending domain knowledge
The tools for model explainability show us features that affect the model’s output the most. Some relations among features and correlation with the output can be very intuitive and known to experts, e.g. if you are trying to predict whether or not a customer will default on a loan, the history of their repayment can be an important factor. However, models very often detect correlation previously unexplored by human. Thanks to it, human decisions can be better in the future, even if you will not decide to replace them with the model.
6. Regulatory compliance
If a model is being used to determine whether or not you can get approved for something (a loan, medical insurance, etc.), then it is important to be sure that the model makes sense and provides an accurate answer. If the decision is based on an opaque black box, you may have no idea why one person was approved and another was not. This lack of transparency also means that it will be difficult to prove that the model is working properly in court if there are issues with its predictions going forward.
These six reasons explain why the interpretability of a model is important.
Having an interpretable model is important for being sure that the model works well and for building trust between you and your end users. It is also important for debugging the model, which can help you quickly isolate issues and fix them before deploying the model in production.
Model explaination is useful also if you will not use the current version of your model — by enabling building simpler alternative or by extending kowledge of human experts and improving their decisions.
Finally, if you are going through regulatory compliance checks, having an interpretable version of your model will make these procedures much easier.
I hope you have found this article useful in your data science journey. Please join us on our blog for more articles!
The project aims to develop an advanced system that enables the detection of faults, disturbances, and other issues in the electrical infrastructure, thereby improving its safety and efficiency.
Project Objectives:
Real-time monitoring of electrical infrastructure..
Identification of potential threats, such as damages to transmission lines, vegetation encroachment on the lines, insulator damages, and contamination on the lines.
Generating reports from power grid monitoring.
Project Progress:
1. Data Collection from Cameras:
Recorded hundreds of hours of video footage from drones, focusing on electrical transmission lines.
2. Data Labeling:
Annotators labeled the data, marking various areas for monitoring, including:
Visible faults in transmission lines,
Vegetation encroachment on the lines,
Insulator damages,
Contaminations on the lines.
3. Utilization of Pretrained AI Algorithms:
Pretrained models based on deep learning and Convolutional Neural Networks (CNN) were employed.
4. Algorithm Fine-Tuning:
Algorithms were fine-tuned for predicting disturbances in the electrical infrastructure through training on labeled data.
5. Offline Experiments on Historical Data:
Achieved an accuracy of 92% on historical data, serving as a starting point for further improvements.
6. Data Collection and Algorithm Validation:
Additional data was gathered and used to evaluate the algorithm, achieving an accuracy of 89.5%.
7. Iterations to Improve the Algorithm:
Ensemble techniques were applied, combining results from different models, resulting in a 94% accuracy.
8. Work on AI Model Size Reduction:
To enable deployment on target devices, the model was optimized while preserving its effectiveness.
9. Pilot - Algorithm Deployment in Two Test Locations:
The algorithm was tested in real-world conditions at two locations, allowing assessment and adaptation to different terrain conditions.
10. Generating Drone Flight Reports:
The algorithm was integrated with drones, enabling the generation of reports with monitoring results after each drone flight.
Investments and Resource Allocation:
The total project cost was 800,000 PLN, distributed as follows:
Data collection, preparation, and labeling: 50,000 PLN.
Initial model development (Proof of Concept): 150,000 PLN.
Testing: 80,000 PLN.
Revisions and final model development: 420,000 PLN.
Operational Cost Reduction: By applying AI algorithms in monitoring electrical infrastructure, operational costs were reduced by 15%, including field inspections and time-consuming analyses.
Reduction in Failure Costs: Early detection of faults led to an 18% reduction in costs associated with failures, avoiding catastrophic damages and prolonged downtimes.
Annual Financial Savings: Assuming a consistent reduction in operational costs and avoidance of failure-related costs, estimated annual savings are 2.5 million PLN.
Shortened Incident Response Time: The average response time to electrical incidents decreased by 70%, leading to quicker issue resolution and minimized incident impacts.
Are you interested in a similar solution?
Polish Office COGITA Sp. z o.o. ul. Łąkowa 4 42-282 Widzów, Poland
UK Office COGITA.AI Limited 93 Tanorth Road Bristol, BS14 0NT, England