





A technical drawing contains much more than a picture of a part. It describes dimensions, tolerances, holes, threads, surface finish and manufacturing instructions. Turning that information into usable data means finding small marks, reading them correctly and preserving their position on the page.
That last requirement matters. A system might read 50 ±0.2 correctly but place it beside the wrong feature. For software that supports engineering or quotation workflows, the number alone is not enough.
Drawing2Data-Bench is COGITA's toolkit for developing and evaluating AI for this problem. It connects three parts of the work: generating labelled drawings from CAD files, testing vision-language models, and training a dedicated detector.
The documented experiments show a useful pattern: general-purpose models can recover much of the text, but precise localization remains difficult. A dedicated RF-DETR detector achieves the highest box precision in the reported comparison, while Gemini 3.5 Flash achieves the highest box F1. Understanding that difference helps explain why the toolkit contains all three components.
What the repository contains
| Component | What it does | Why it matters |
|---|---|---|
generation/ | Converts 3D CAD models into 2D drawing images and matching labels. | Creates training examples without manually marking every annotation. |
benchmarks/ | Runs models on drawings and evaluates their structured predictions. | Separates text extraction quality from the ability to locate annotations. |
extraction/ | Trains and runs an RF-DETR Large detector. | Provides a specialized model for finding annotation regions. |
The workflow starts with a CAD model. The generator produces an image and its reference labels. Those pairs can then be used both to train a detector and to evaluate models against known answers. Each component is described in the repository overview.
1. Generate labelled 2D drawings from 3D CAD
Training an image model requires examples of what it should find. For a technical drawing, that might mean a rectangle around a dimension, a label saying what kind of annotation it is, and the text printed inside it.
Creating these labels by hand takes time. A single page can contain dozens of small annotations, and the person labelling it needs to understand engineering notation.
The repository's generator, AutoDraft, creates the drawing and its labels together. It accepts STEP, IGES and BREP files, which store 3D CAD geometry. It uses that geometry to select views, draw the part, add dimensions and callouts, and arrange them on a sheet. The output is a PNG image and COCO annotations. COCO is a common dataset format that records objects, their categories and their positions in an image.
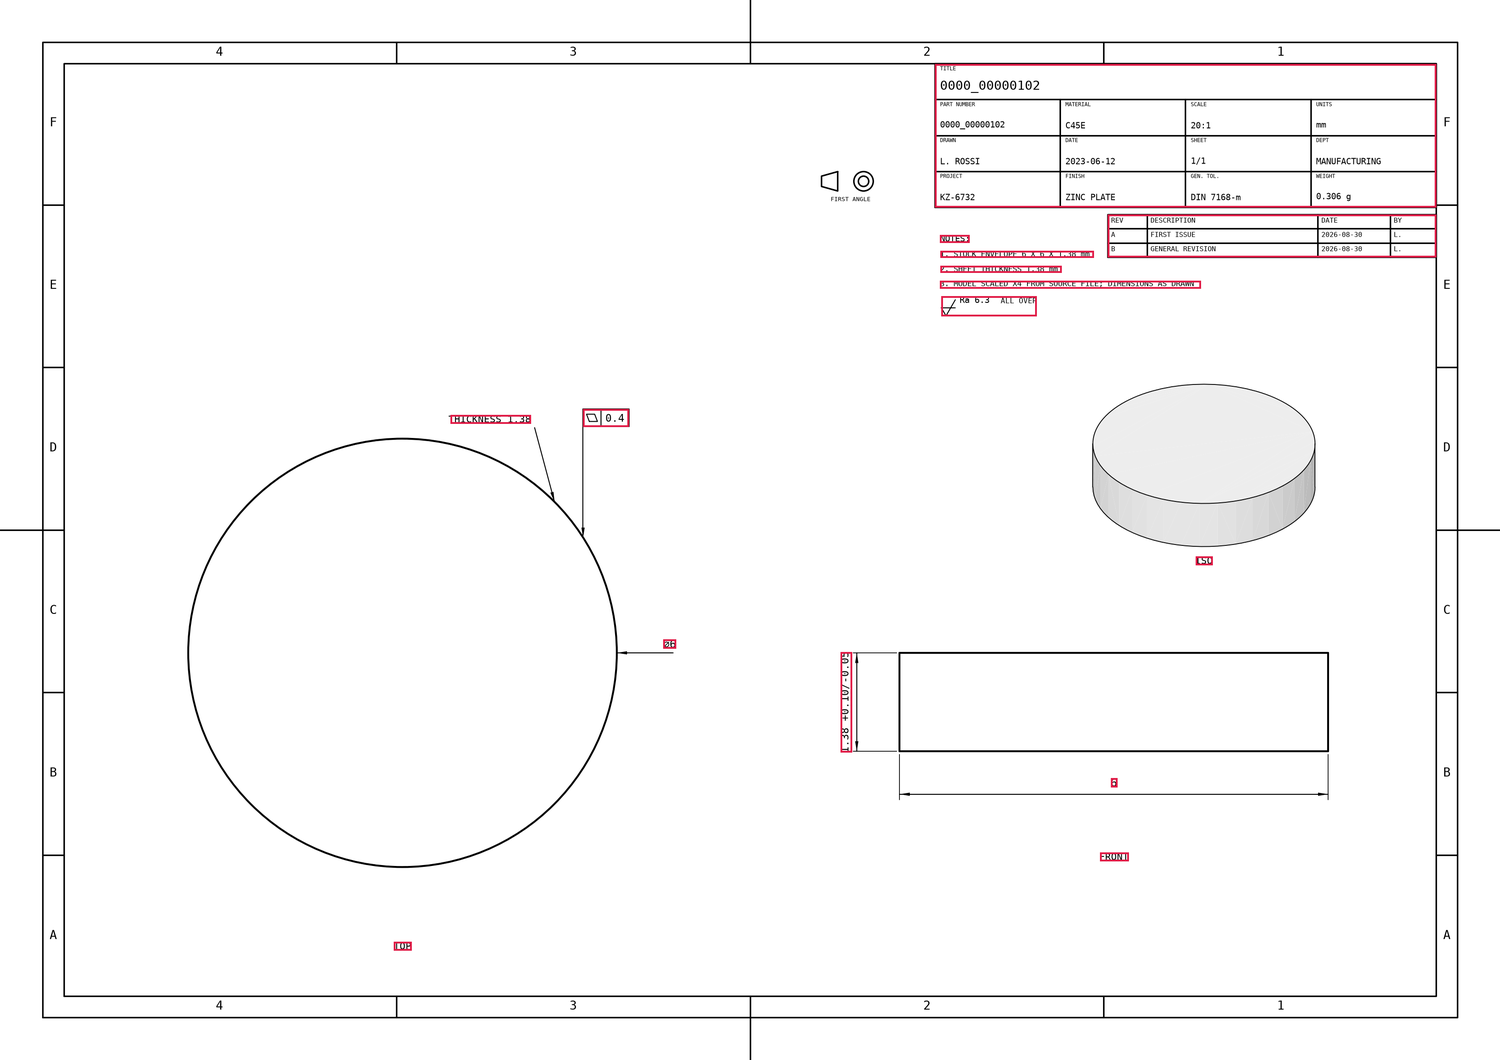
A generated drawing with its reference labels. The red boxes come from the generator's annotation records; they are the answers a detector is expected to learn.
AutoDraft supports 12 annotation categories, including dimensions, radii, chamfers, bores, threads, surface-finish symbols, notes, tables and view captions. It also covers GD&T, or geometric dimensioning and tolerancing, and datums, the reference features used to define measurements and tolerances.
An annotation includes its category, text and bounding box. Additional fields preserve information such as the measured value, view and whether a specification was generated artificially. Most boxes focus on the annotation itself rather than the long dimension or leader line around it. A table is represented by one box around the complete block.
Variety helps a model learn more than one layout
AutoDraft provides ten drawing styles, with different sheet layouts, arrowheads, text placement, tolerances and title blocks. It can create section views that reveal internal features, enlarged detail views, and separate views of bodies in an assembly. Presentation details also vary within a style.
This matters because a model trained on one fixed layout may learn where labels usually appear instead of learning to recognize them. A broader range of layouts gives developers a better starting point for training models that process 2D drawings.
The labels include text, so the generated data could also support future OCR or vision-language fine-tuning. The training code currently supplied in this repository focuses on object detection.
There is one distinction to preserve: some specifications are synthetic. Surface-finish values are generated, and certain other annotations can be generated when the CAD file lacks embedded manufacturing information. These items are flagged. They can teach a model what a symbol or label looks like, but their invented values should not be treated as real requirements for the original part. See the generation documentation for the supported conventions and limitations.
2. Measure what Gemini and GPT actually extract
A vision-language model, or VLM, accepts images as well as text. Drawing2Data-Bench includes adapters for Gemini and GPT models through OpenRouter, alongside the local detector.
The benchmark asks each VLM to return structured features: the annotation's text, category, bounding box and confidence. Predictions are saved as JSON, then compared with the reference labels. A YAML configuration selects the dataset, models, metrics and sample count.
This makes it possible to ask three separate questions:
- Did the model find the annotation? Its predicted box must overlap the reference box sufficiently.
- Did it read and classify the annotation correctly? The text and category must match.
- Did it do both at the same location? The text, category and position must all be correct.
For box matching, the benchmark uses intersection over union, or IoU: the area shared by two boxes divided by the total area covered by them. A match requires IoU above 0.5. This makes the evaluation stricter than simply checking whether a box is somewhere near the right number.
The reported comparison
The benchmark documentation reports a run named benchmark_15, using 15 generated drawings. The following table reproduces its localization results. All three scores are better when higher.
| Model | Box precision | Box recall | Box F1 |
|---|---|---|---|
Local RF-DETR detector (custom) | 0.9777 | 0.6050 | 0.7474 |
| Gemini 3.1 Flash Lite | 0.6525 | 0.6381 | 0.6453 |
| Gemini 3.5 Flash | 0.7762 | 0.7569 | 0.7664 |
| GPT-5.6 Luna* | 0.2066 | 0.2029 | 0.2047 |
| GPT-5.6 Terra | 0.5363 | 0.3674 | 0.4361 |
| GPT-5.6 Sol | 0.5430 | 0.5580 | 0.5504 |
Source: documented benchmark results. Luna's scores cover 14 outputs because one response exceeded an output-length limit. Model names follow the repository.
Precision tells us what proportion of the predicted boxes match reference annotations. Recall tells us how much of the reference annotation inventory was found. F1 combines the two, so a model cannot achieve a strong F1 simply by returning a few very accurate boxes.
The local detector's precision of 97.77% is higher than every VLM in this run. Its recall of 60.50%, however, shows that it still misses many annotations. Gemini 3.5 Flash finds more of them and achieves the best balance of precision and recall.
These box scores ignore text and category. A correctly located rectangle can count as a match even if its text is empty or its class is wrong.
Reading the text is only part of the problem
The feature metrics add text and category to the evaluation. The first column below ignores position; the second also requires the annotation to be in the right place.
| VLM | Exact text + category F1 | Exact text + category + location F1 |
|---|---|---|
| Gemini 3.1 Flash Lite | 0.8352 | 0.5922 |
| Gemini 3.5 Flash | 0.8615 | 0.6797 |
| GPT-5.6 Luna* | 0.8279 | 0.1869 |
| GPT-5.6 Terra | 0.7246 | 0.4033 |
| GPT-5.6 Sol | 0.8529 | 0.5041 |
Source: the same benchmark results, with the same 14-output exception for Luna. Exact matching compares the stored text and category. Table features use labels such as TITLE BLOCK; this run does not evaluate the transcription of every table cell.
Every model loses ground when location becomes part of the requirement. For Gemini 3.5 Flash, the score falls from 0.8615 to 0.6797. For GPT-5.6 Sol, it falls from 0.8529 to 0.5041.
That gap is the most useful finding for developers. A model can return many correct labels without reliably placing them on the drawing. A convincing text response therefore does not establish that the drawing has been extracted accurately. Even correct annotation localization is only one step toward linking each label to the physical feature it describes.
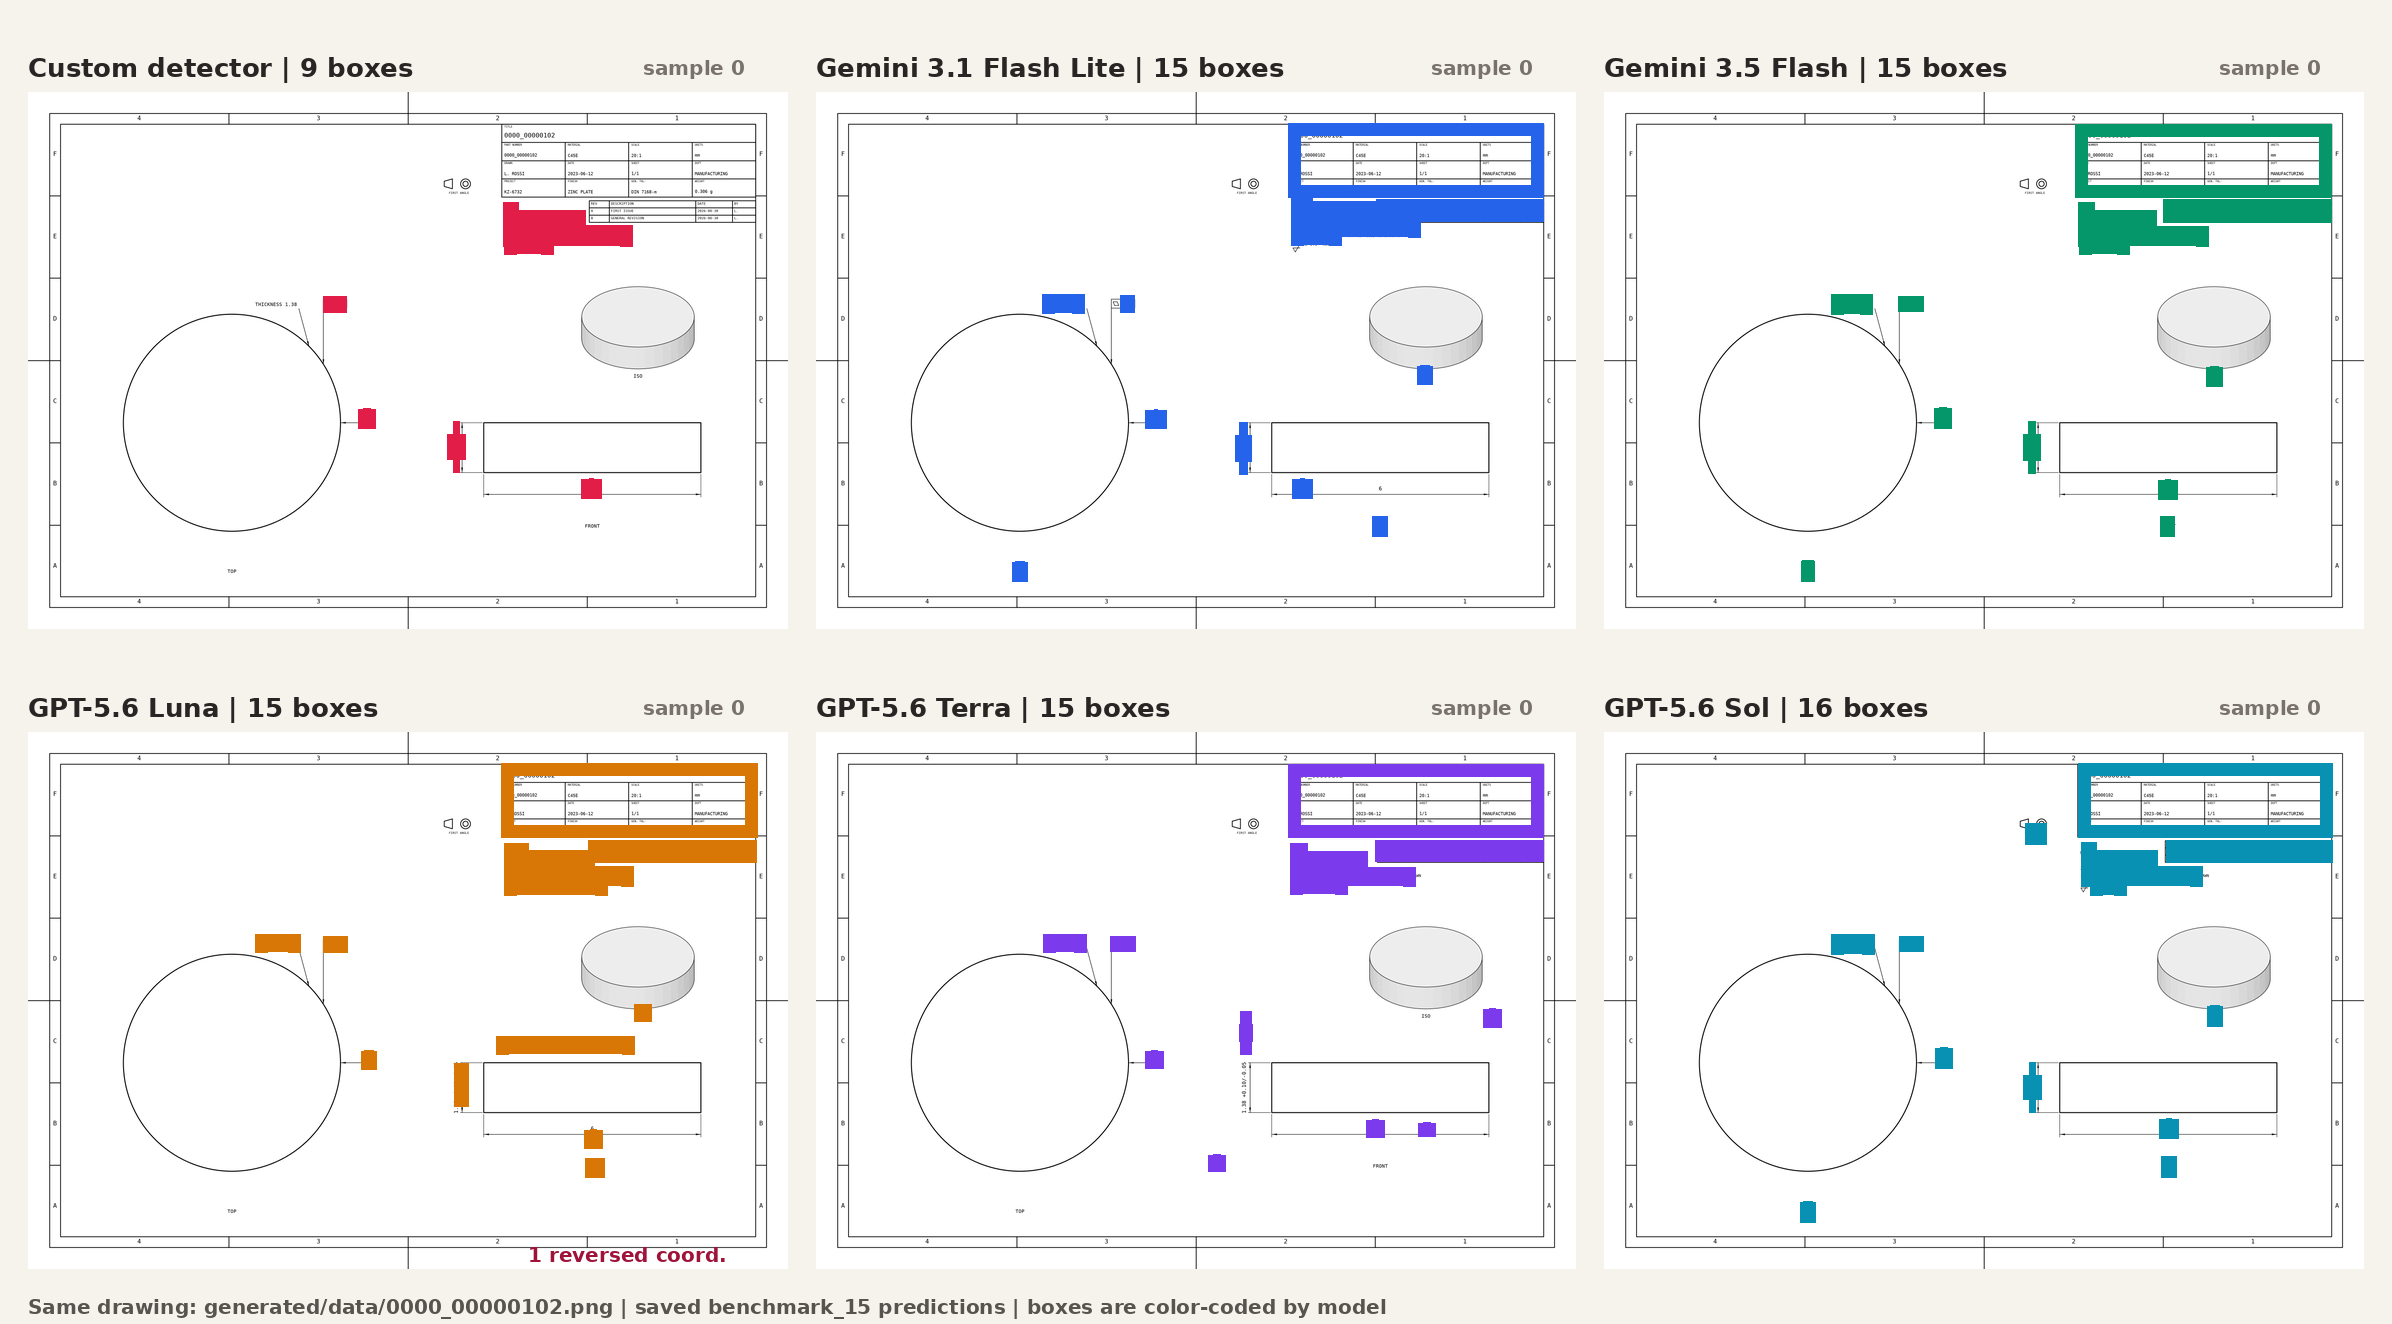
The repository's comparison of six models on one drawing. These are model predictions, not reference boxes. The panels illustrate differences in coverage and placement; the tables above summarize the reported run.
3. Train a dedicated RF-DETR detector
The extraction component uses RF-DETR Large, an object detector trained to find and classify annotation regions.
Its job is to return boxes around objects such as dimensions, notes and tables. It does not transcribe their text. The benchmark adapter returns an empty text field for each detection, which explains the detector's zero scores on the reported text metrics.
The extraction documentation describes a generated dataset of 9,378 images and 228,327 annotations, divided as follows:
| Split | Images | Annotations |
|---|---|---|
| Training | 6,513 | 158,727 |
| Validation | 1,886 | 45,942 |
| Test | 979 | 23,658 |
Training examples teach the model; validation examples track its progress; test examples are held aside for evaluation. These dataset counts describe the documented training work, while the VLM comparison above uses the separate 15-sample benchmark configuration.
The reported training run used 20 epochs, meaning 20 passes through the training data. The training script also applies transformations such as rotation, perspective distortion, blur, noise and compression to expose the detector to less pristine images.
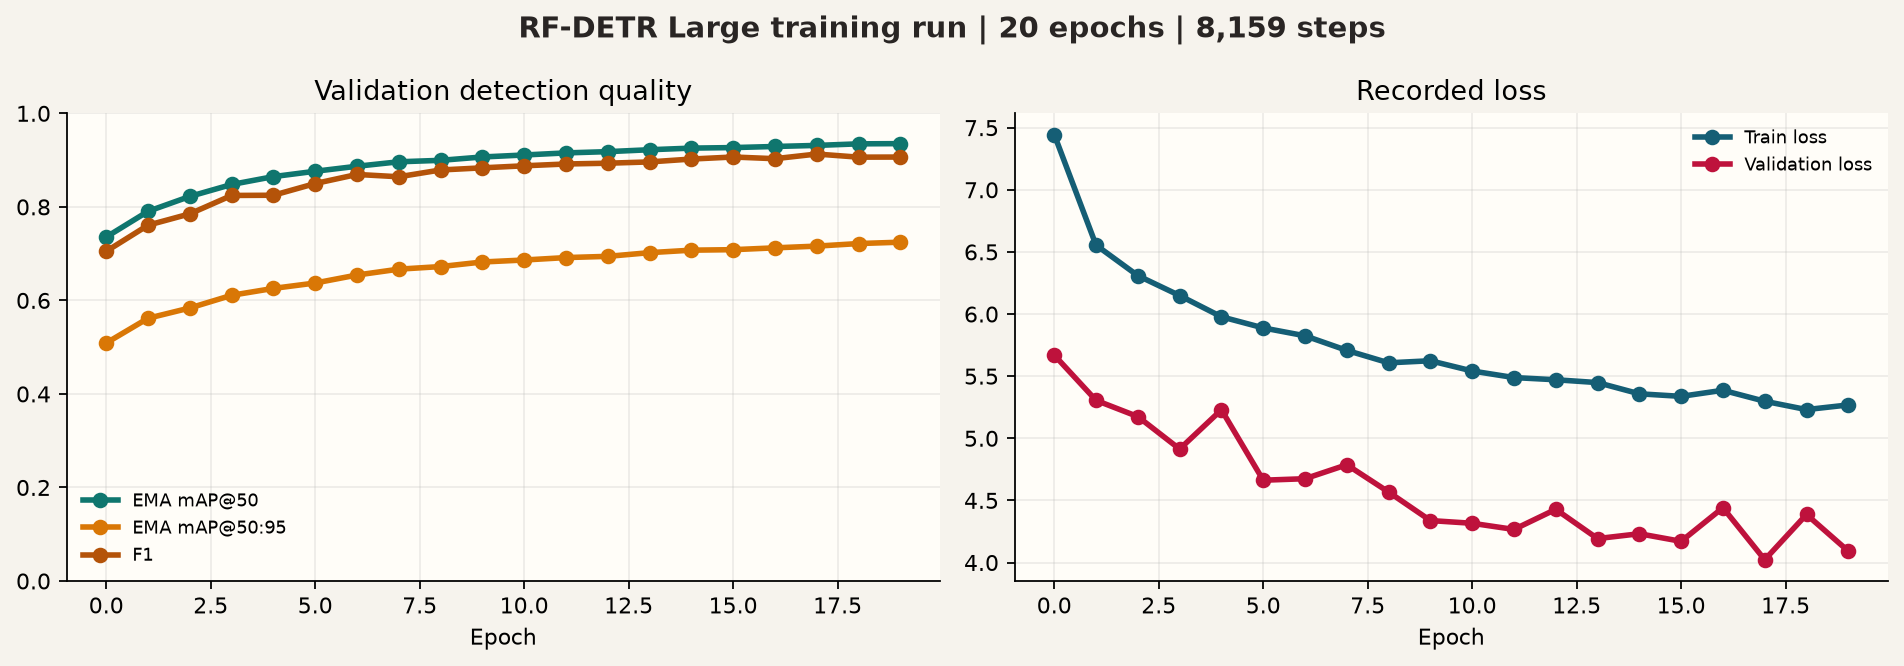
Recorded training curves supplied with the repository. Detection scores improve across the run, while the training and validation error measures generally decrease.
The documentation reports a final validation mAP@50 of 0.9352 and mAP@50:95 of 0.7245 for the averaged model weights. These are object-detection scores: the second evaluates box matching across a range of increasingly strict overlap requirements. They come from a different evaluation setup and should be kept separate from the small benchmark's F1 scores. The extraction documentation provides the full training settings and per-class results.
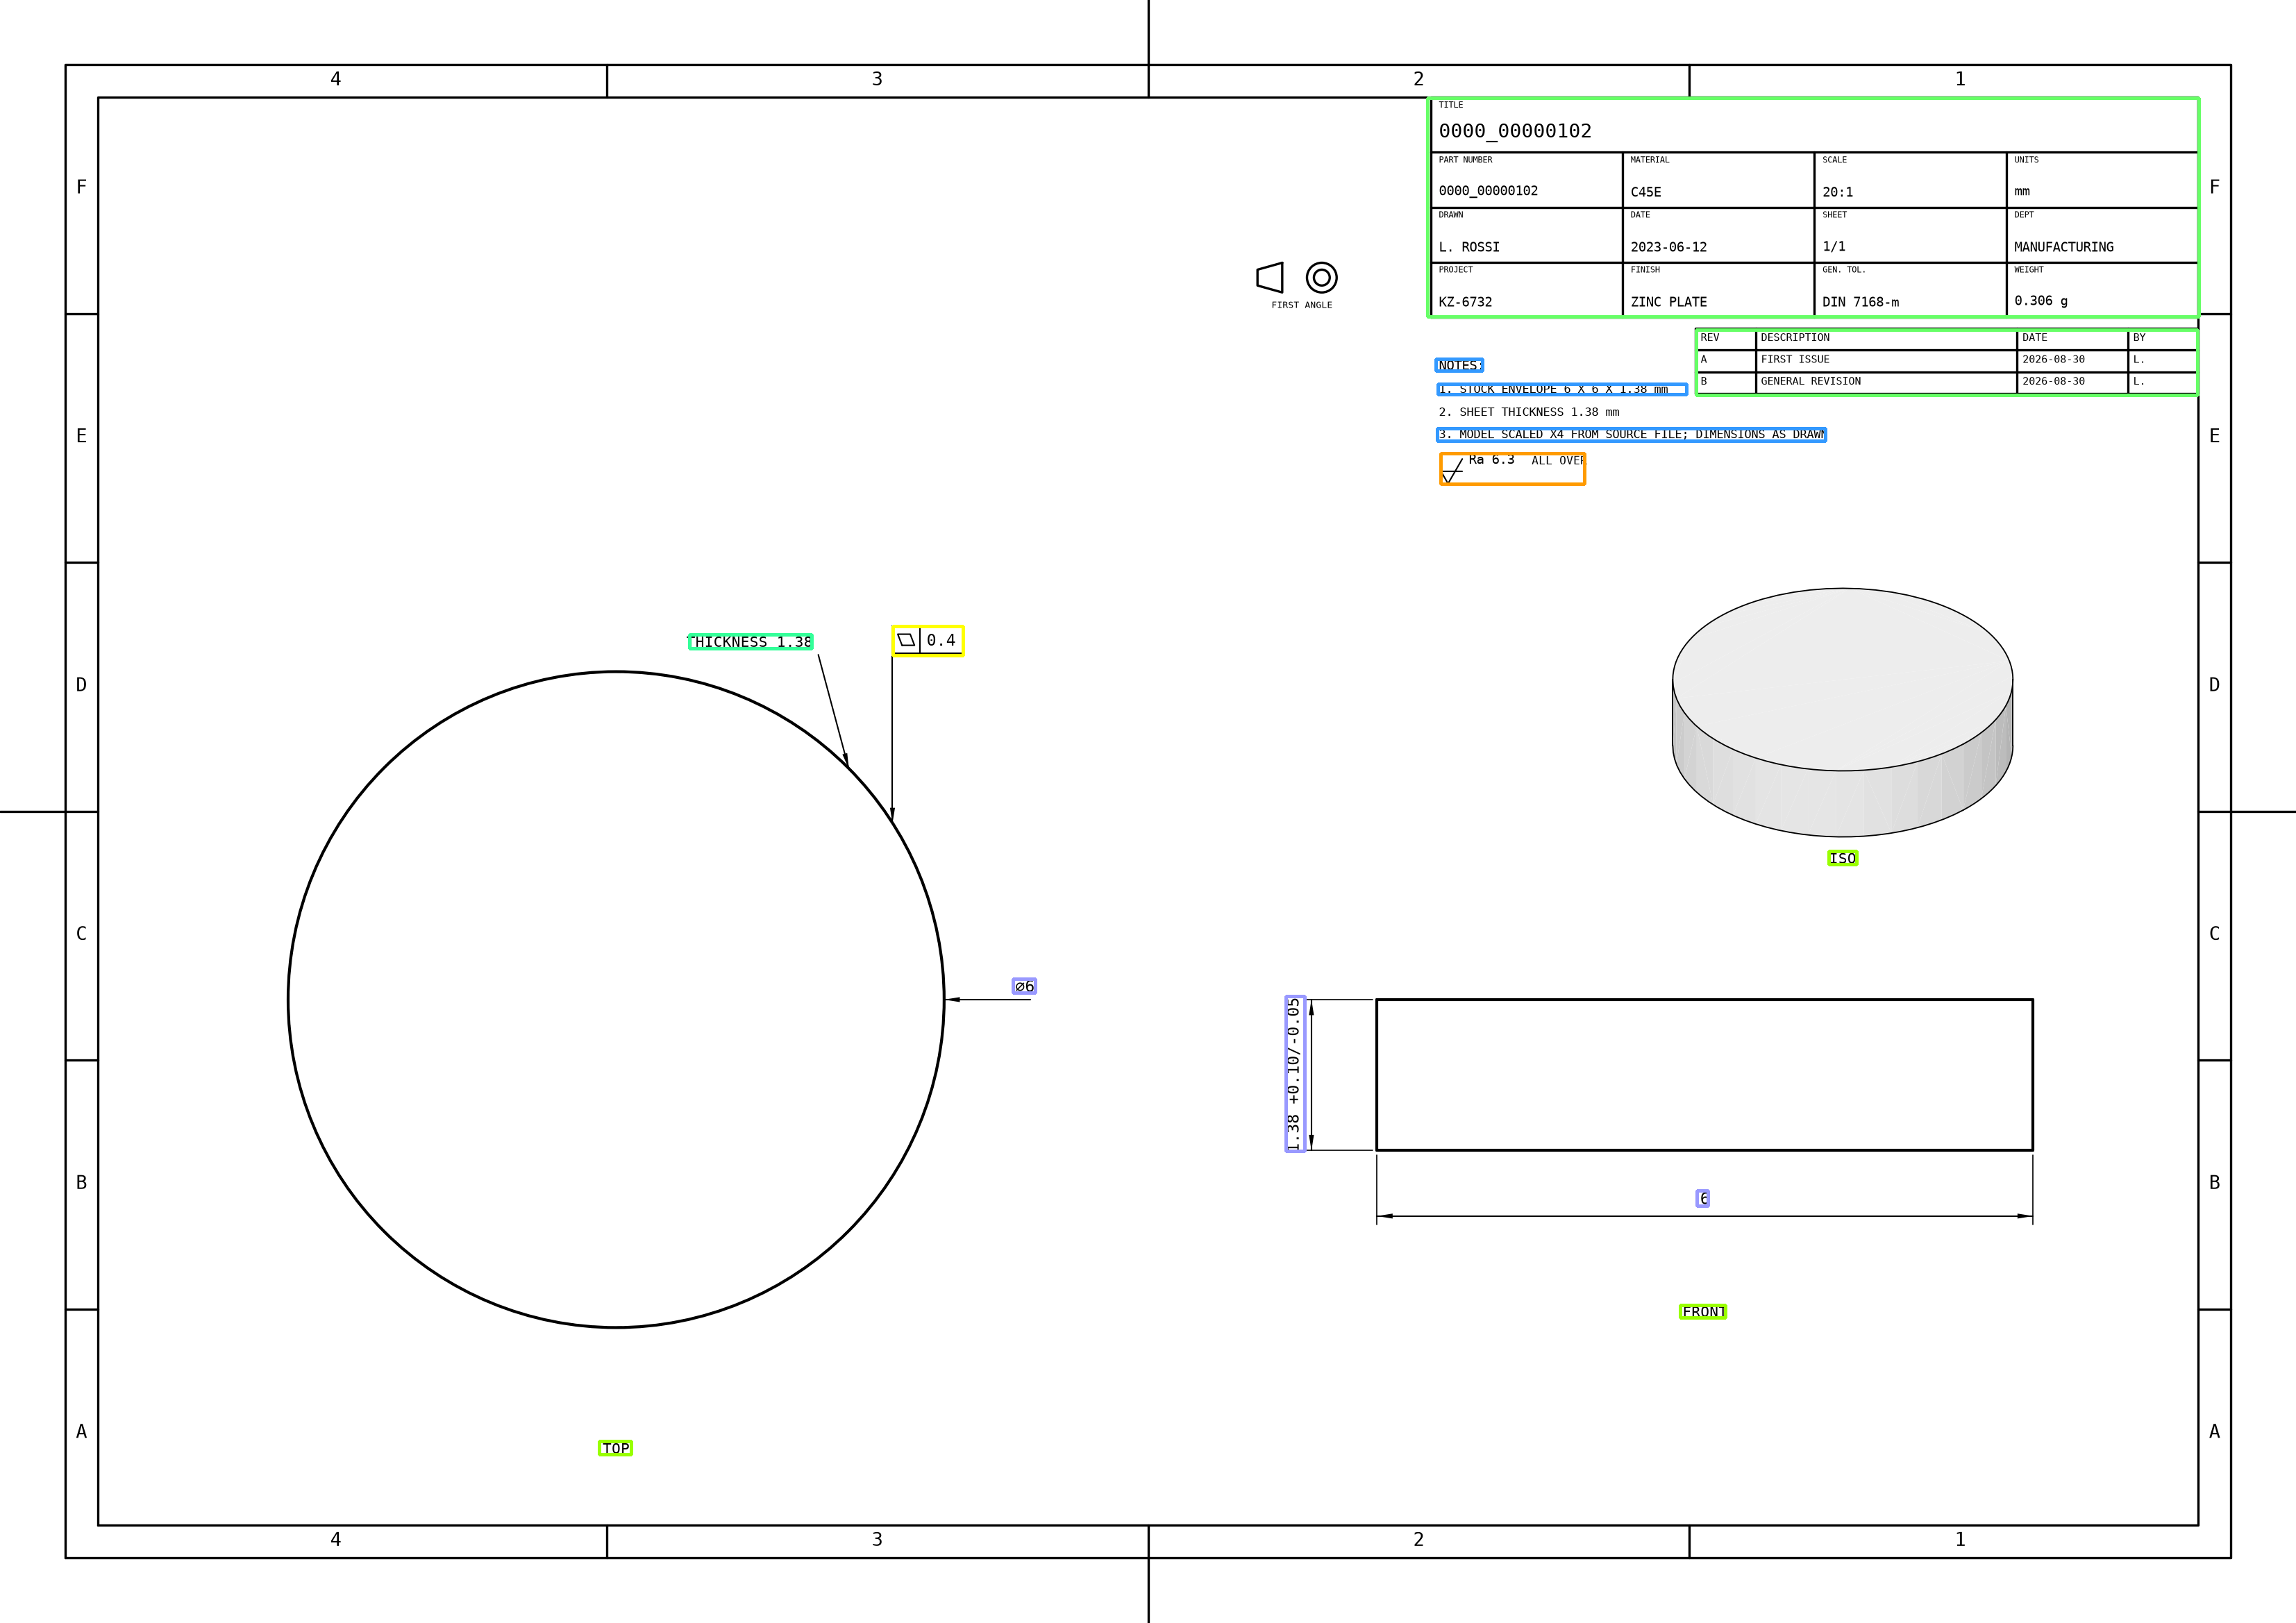
The standalone inference example contains 14 detections at a confidence threshold of 0.5. It shows detected regions, without an OCR transcription. It is a separate example from the six-model comparison above.
In the reported benchmark, the detector exceeds four of the five VLMs on box F1 and all five on box precision. That supports a practical direction for further work: use a specialized model to find promising regions, then pass those crops to OCR or a VLM for reading. The repository provides the detector and evaluation tools; this combined reading pipeline remains a next step.
How to try the toolkit
Start by cloning the repository and installing its dependencies:
git clone https://github.com/COGITA-AI/drawing2data-bench.git
cd drawing2data-bench
python -m pip install -r requirements.txt
Generate a small dataset from the included CAD examples:
python -m generation.cli "generation/examples/models/*.step" -o datasetInspect the generated labels before training:
python -m generation.tools.coco_view dataset/trainWith a suitable dataset and CUDA GPU available, the training entry point is:
python -m extraction.train \
  --dataset-dir ./dataset \
  --epochs 20 \
  --batch-size 8 \
  --grad-accum-steps 2
The supplied training script selects CUDA directly. The few included CAD examples are useful for exploring the generator; reproducing the documented training results requires the larger dataset and corresponding setup.
For VLM evaluation, the benchmark guide explains the configuration and the OPENROUTER_API_KEY setting. Benchmark commands run from benchmarks/. The generated benchmark dataset has its own expected location, benchmarks/datasets/generated/data/; creating the training dataset alone does not populate it.
The repository links to a shared artifact folder for larger files. The reviewed Git checkout contains the source code, example CAD files, documentation and figures, but does not include the full training dataset, checkpoints or raw benchmark_15 outputs.
What these results establish
Drawing2Data-Bench provides a concrete starting point for generating training data and measuring specific drawing-understanding tasks. Its reported results show why text quality, localization precision and annotation coverage need separate evaluation.
The current evidence also has clear limits. The comparison uses a small synthetic sample, and the documentation reports weak transfer of the detector to real printed drawings. All VLMs use a shared prompt and coordinate convention, so this is a comparison under that setup. Different prompts or preprocessing could change the ranking. The numbers in this article reproduce the repository's documented experiments; they were not independently rerun for this article. A fresh reproduction should also verify coordinate scaling and category mappings in the current adapters.
For teams building engineering software, the toolkit makes the next experiments tangible: generate examples, inspect the labels, compare models on representative drawings, and measure what improves when detection and text reading are combined.
Explore the code and documentation in COGITA's Drawing2Data-Bench repository.